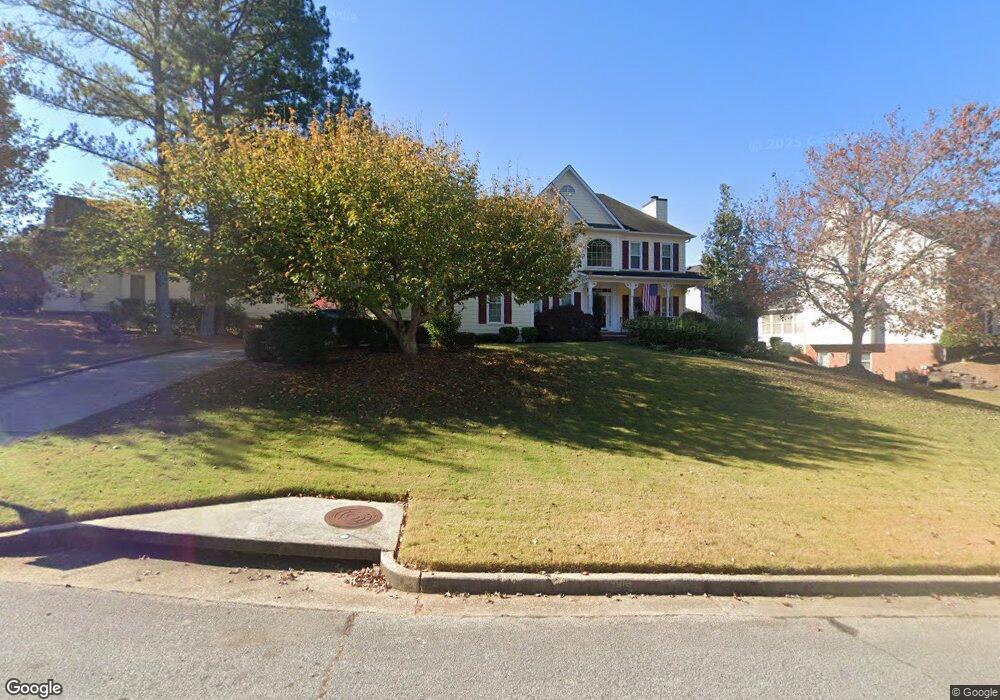
1809 Thornhill Pass SE Unit 7 Conyers, GA 30013
Estimated Value: $354,526 - $373,000
4
Beds
4
Baths
2,473
Sq Ft
$147/Sq Ft
Est. Value
About This Home
This home is located at 1809 Thornhill Pass SE Unit 7, Conyers, GA 30013 and is currently estimated at $362,882, approximately $146 per square foot. 1809 Thornhill Pass SE Unit 7 is a home located in Rockdale County with nearby schools including Flat Shoals Elementary School, Memorial Middle School, and Salem High School.
Ownership History
Date
Name
Owned For
Owner Type
Purchase Details
Closed on
Feb 20, 2024
Sold by
Sedlacek Joseph F
Bought by
Joseph & Barbara Sedlacek Living Trust D and Sedlacek Barbara Rinda Tr
Current Estimated Value
Purchase Details
Closed on
Dec 21, 2001
Sold by
Brubaker Ralph E and Brubaker Rhonda A
Bought by
Sedlacek Joseph F
Home Financials for this Owner
Home Financials are based on the most recent Mortgage that was taken out on this home.
Original Mortgage
$100,000
Interest Rate
6.72%
Mortgage Type
New Conventional
Purchase Details
Closed on
Aug 10, 1995
Sold by
John Wieland Homes Inc
Bought by
Brubaker Ralph Rhonda Ann
Create a Home Valuation Report for This Property
The Home Valuation Report is an in-depth analysis detailing your home's value as well as a comparison with similar homes in the area
Home Values in the Area
Average Home Value in this Area
Purchase History
| Date | Buyer | Sale Price | Title Company |
|---|---|---|---|
| Joseph & Barbara Sedlacek Living Trust D | -- | -- | |
| Sedlacek Joseph F | $242,000 | -- | |
| Brubaker Ralph Rhonda Ann | $169,300 | -- |
Source: Public Records
Mortgage History
| Date | Status | Borrower | Loan Amount |
|---|---|---|---|
| Previous Owner | Sedlacek Joseph F | $100,000 | |
| Closed | Brubaker Ralph Rhonda Ann | $0 |
Source: Public Records
Tax History Compared to Growth
Tax History
| Year | Tax Paid | Tax Assessment Tax Assessment Total Assessment is a certain percentage of the fair market value that is determined by local assessors to be the total taxable value of land and additions on the property. | Land | Improvement |
|---|---|---|---|---|
| 2024 | $3,019 | $149,760 | $29,520 | $120,240 |
| 2023 | $2,937 | $152,680 | $29,000 | $123,680 |
| 2022 | $2,511 | $123,840 | $22,600 | $101,240 |
| 2021 | $2,216 | $106,800 | $19,320 | $87,480 |
| 2020 | $2,083 | $100,040 | $18,800 | $81,240 |
| 2019 | $1,589 | $81,960 | $13,200 | $68,760 |
| 2018 | $1,402 | $75,640 | $10,040 | $65,600 |
| 2017 | $1,265 | $70,720 | $10,040 | $60,680 |
| 2016 | $1,130 | $70,720 | $10,040 | $60,680 |
| 2015 | $1,047 | $67,840 | $10,040 | $57,800 |
| 2014 | $833 | $66,080 | $8,280 | $57,800 |
| 2013 | -- | $79,920 | $14,400 | $65,520 |
Source: Public Records
Map
Nearby Homes
- 1613 Brentwood Crossing SE Unit 3
- 2303 Deerfield Chase SE Unit 5
- 2320 Deerfield Chase SE Unit 5
- 2239 Mission Ridge Dr SE
- 2235 Kings Forest Dr SE
- 2225 Kings Forest Dr SE
- 2215 Kings Forest Dr SE
- 2405 Old Salem Rd SE Unit 1
- 2193 Kings Forest Dr SE
- 2365 Brentmoore Point Unit 3
- 2246 Exchange Place SE
- 2259 Old Salem Rd SE
- 0 Flat Shoals Rd SE
- 1975 Flat Shoals Rd SE
- 00 Flat Shoals Rd SE
- 2270 Flat Shoals Rd SE
- 1646 Ellington Rd SE
- 2112 Bradford Pear Cir SE
- 1819 Dawn Rd Unit 16
- 1823 Dawn Rd Unit 18
- 1805 Thornhill Pass SE
- 1813 Thornhill Pass SE
- 1903 Bent Oak Way Unit 8
- 0 Thornhill Pass SE Unit 8545192
- 0 Thornhill Pass SE Unit 8145279
- 0 Thornhill Pass SE
- 1806 Thornhill Pass SE
- 1803 Thornhill Pass SE Unit 7
- 0 Winsor Crossing SE Unit 8645300
- 0 Winsor Crossing SE
- 0 Bent Oak Way SE Unit 8481100
- 1905 Bent Oak Way Unit 8
- 1812 Winsor Crossing SE Unit 42
- 1804 Thornhill Pass SE
- 1814 Thornhill Pass SE
- 1802 Thornhill Pass SE Unit 7
- 1801 Thornhill Pass SE Unit 7
- 1808 Winsor Crossing SE
- 1902 Bent Oak Way SE
- 1900 Bent Oak Way