1809 W Bond St Denison, TX 75020
Estimated Value: $168,955 - $283,000
3
Beds
2
Baths
1,496
Sq Ft
$151/Sq Ft
Est. Value
About This Home
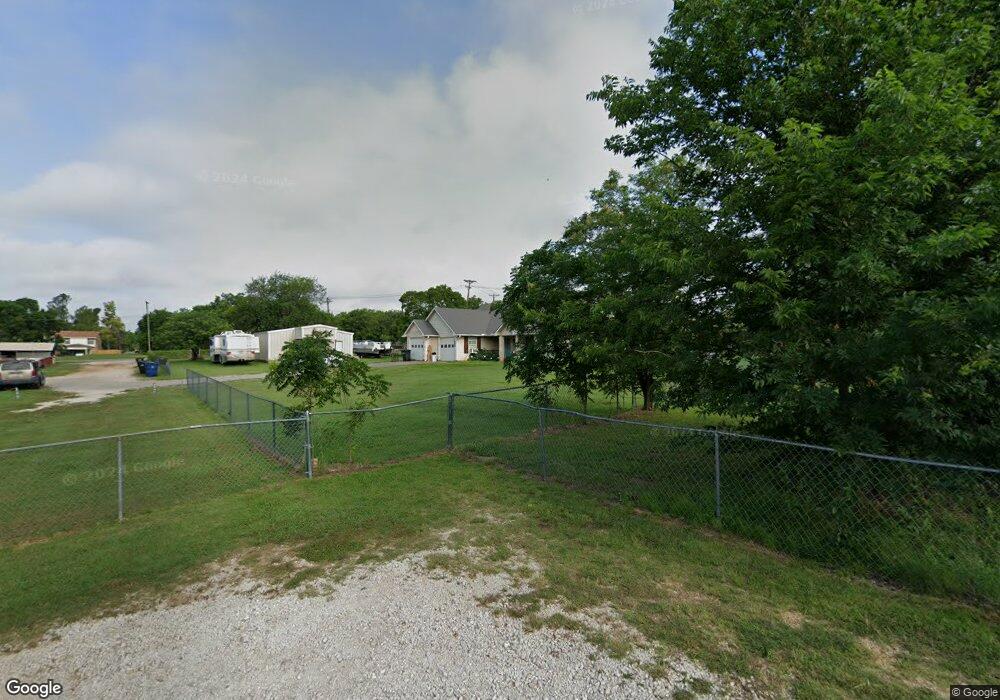
This home is located at 1809 W Bond St, Denison, TX 75020 and is currently estimated at $225,978, approximately $151 per square foot. 1809 W Bond St is a home located in Grayson County with nearby schools including Mayes Elementary School, Scott Middle School, and Denison High School.
Ownership History
Date
Name
Owned For
Owner Type
Purchase Details
Closed on
Oct 26, 2016
Sold by
Cunningham Levi Daniel and Cunningham Ashley
Bought by
Morgan Faron and Morgan Ashley
Current Estimated Value
Home Financials for this Owner
Home Financials are based on the most recent Mortgage that was taken out on this home.
Original Mortgage
$147,250
Outstanding Balance
$118,439
Interest Rate
3.48%
Mortgage Type
New Conventional
Estimated Equity
$107,539
Purchase Details
Closed on
Jul 16, 2015
Sold by
Cunningham Shannon
Bought by
Cunningham Levi
Create a Home Valuation Report for This Property
The Home Valuation Report is an in-depth analysis detailing your home's value as well as a comparison with similar homes in the area
Home Values in the Area
Average Home Value in this Area
Purchase History
| Date | Buyer | Sale Price | Title Company |
|---|---|---|---|
| Morgan Faron | -- | Chapin Title Co | |
| Cunningham Levi | -- | None Available |
Source: Public Records
Mortgage History
| Date | Status | Borrower | Loan Amount |
|---|---|---|---|
| Open | Morgan Faron | $147,250 |
Source: Public Records
Tax History Compared to Growth
Tax History
| Year | Tax Paid | Tax Assessment Tax Assessment Total Assessment is a certain percentage of the fair market value that is determined by local assessors to be the total taxable value of land and additions on the property. | Land | Improvement |
|---|---|---|---|---|
| 2025 | $4,556 | $278,554 | -- | -- |
| 2024 | $5,883 | $253,231 | $0 | $0 |
| 2023 | $5,930 | $230,210 | $106,579 | $155,160 |
| 2022 | $5,711 | $240,350 | $106,579 | $133,771 |
| 2021 | $4,798 | $190,256 | $54,282 | $135,974 |
| 2020 | $5,119 | $194,067 | $49,649 | $144,418 |
| 2019 | $5,168 | $187,805 | $49,649 | $138,156 |
| 2018 | $4,905 | $176,808 | $51,635 | $125,173 |
| 2017 | $4,362 | $155,935 | $35,038 | $120,897 |
| 2016 | $3,601 | $142,653 | $29,789 | $112,864 |
| 2015 | $2,816 | $117,020 | $21,278 | $95,742 |
| 2014 | -- | $118,485 | $22,129 | $96,356 |
Source: Public Records
Map
Nearby Homes
- 1905 W Morton St Unit 6
- 1905 W Morton St Unit 5
- 1905 W Morton St Unit 17
- 1905 W Morton St Unit 20
- 1905 W Morton St Unit 7
- 1915 W Bond St
- 1981 W Bond St
- 1985 W Bond St
- 1721 W Walker St Unit A and B
- 2021 W Walker St
- 1601 W Bond St
- 916 Leeper Dr
- 2112 W Bond St
- 2900 W Morton St
- 3130 W Morton St
- 3030 W Morton St
- 1700 W Morton St
- 3300 W Morton St
- TBD - W Washington St
- 1505 W Johnson St
- 1822 W Bond St
- 1818 W Bond St
- 1830 W Bond St
- 1826 W Bond St
- 1814 W Bond St
- 1901 Juanita Dr
- 1805 W Bond St
- 1825 W Morton St
- 1823 W Morton St
- 1907 Juanita Dr
- 1911 W Bond St
- 1827 W Morton St
- 1800 W Bond St
- 1831 W Morton St
- 1800 W Walker St
- 1909 Juanita Dr
- 1913 W Bond St
- 1905 W Morton St
- 1905 W Morton St
- 1905 W Morton St