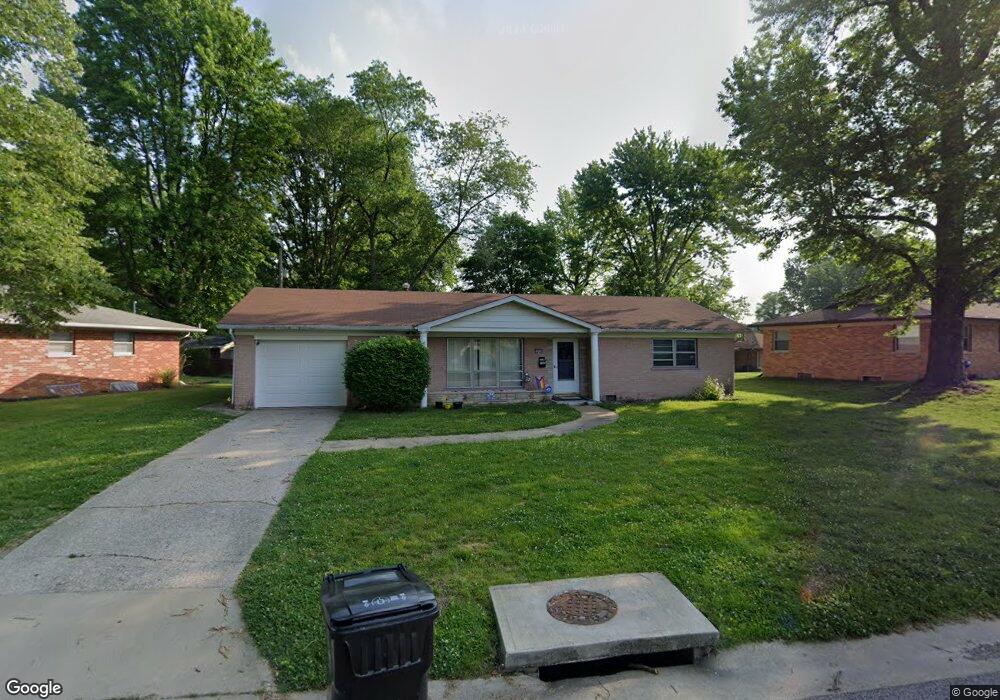
1809 W F St Belleville, IL 62226
Estimated Value: $130,000 - $154,000
3
Beds
1
Bath
1,046
Sq Ft
$137/Sq Ft
Est. Value
About This Home
This home is located at 1809 W F St, Belleville, IL 62226 and is currently estimated at $143,752, approximately $137 per square foot. 1809 W F St is a home located in St. Clair County with nearby schools including Union Elementary School, West Jr High School, and Governor French Academy.
Ownership History
Date
Name
Owned For
Owner Type
Purchase Details
Closed on
Apr 26, 2023
Sold by
Benscoter Deborah A and Jacob R Benscoter Iii Estate Jacob R Benscote
Bought by
Benscoter Deborah A
Current Estimated Value
Purchase Details
Closed on
Jan 30, 2014
Sold by
Mitchell Beverly and Carr Reuter Barbara
Bought by
Benscoter Jacob R
Home Financials for this Owner
Home Financials are based on the most recent Mortgage that was taken out on this home.
Original Mortgage
$79,263
Outstanding Balance
$60,267
Interest Rate
4.5%
Mortgage Type
FHA
Estimated Equity
$83,485
Purchase Details
Closed on
Oct 23, 2012
Sold by
Voellinger Mary B and Carr Vernon Ray
Bought by
Mitchell Beverly and Carr Reuter Barbara
Create a Home Valuation Report for This Property
The Home Valuation Report is an in-depth analysis detailing your home's value as well as a comparison with similar homes in the area
Home Values in the Area
Average Home Value in this Area
Purchase History
| Date | Buyer | Sale Price | Title Company |
|---|---|---|---|
| Benscoter Deborah A | -- | None Available | |
| Benscoter Jacob R | $82,000 | Community Title Shiloh Llc | |
| Mitchell Beverly | -- | None Available |
Source: Public Records
Mortgage History
| Date | Status | Borrower | Loan Amount |
|---|---|---|---|
| Open | Benscoter Jacob R | $79,263 |
Source: Public Records
Tax History Compared to Growth
Tax History
| Year | Tax Paid | Tax Assessment Tax Assessment Total Assessment is a certain percentage of the fair market value that is determined by local assessors to be the total taxable value of land and additions on the property. | Land | Improvement |
|---|---|---|---|---|
| 2024 | $3,128 | $35,572 | $4,851 | $30,721 |
| 2023 | $3,139 | $33,436 | $4,756 | $28,680 |
| 2022 | $2,881 | $30,101 | $4,282 | $25,819 |
| 2021 | $2,775 | $27,828 | $3,959 | $23,869 |
| 2020 | $2,697 | $26,315 | $3,743 | $22,572 |
| 2019 | $2,745 | $26,498 | $3,748 | $22,750 |
| 2018 | $2,684 | $25,925 | $3,667 | $22,258 |
| 2017 | $2,663 | $25,742 | $3,641 | $22,101 |
| 2016 | $2,630 | $25,196 | $3,564 | $21,632 |
| 2014 | $2,270 | $24,545 | $5,949 | $18,596 |
Source: Public Records
Map
Nearby Homes