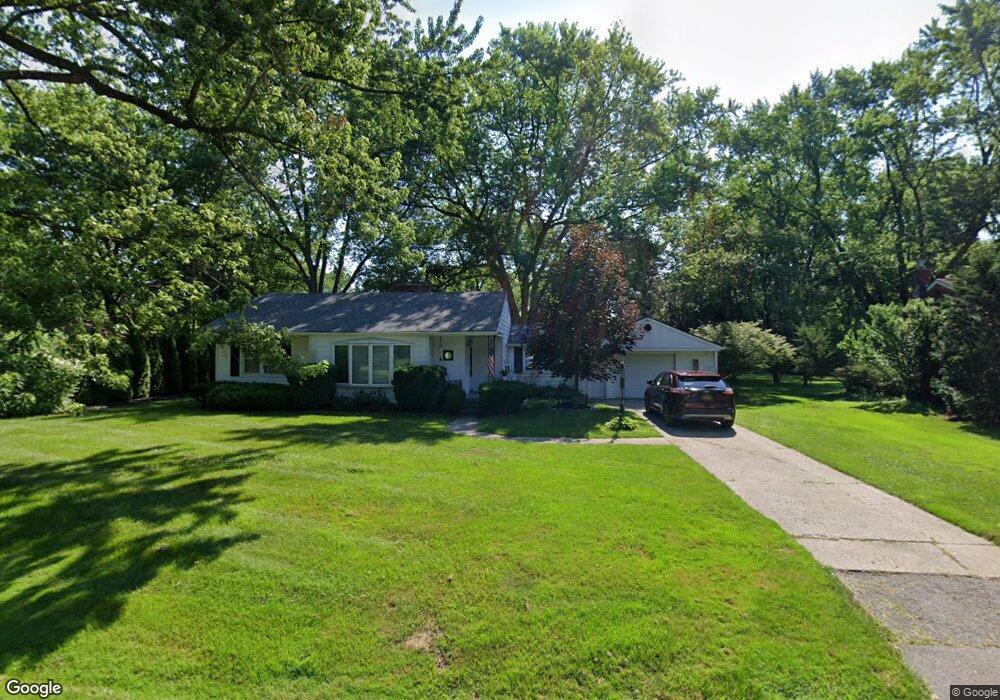
18096 Lathers St Livonia, MI 48152
Estimated Value: $199,160 - $261,000
--
Bed
1
Bath
1,332
Sq Ft
$179/Sq Ft
Est. Value
About This Home
This home is located at 18096 Lathers St, Livonia, MI 48152 and is currently estimated at $238,040, approximately $178 per square foot. 18096 Lathers St is a home located in Wayne County with nearby schools including Coolidge Elementary School, Riley Upper Elementary School, and Webster Elementary School.
Ownership History
Date
Name
Owned For
Owner Type
Purchase Details
Closed on
Sep 21, 2020
Sold by
Obryan Donald and Obryan Carrie Jane
Bought by
Obryan Donald and Obryan Carrie Jane
Current Estimated Value
Purchase Details
Closed on
Jun 14, 2016
Sold by
Donald O Bryan Norma Lee and Bryan Donald O
Bought by
Jane O Bryan Donald and Bryan Carrie Jane O
Home Financials for this Owner
Home Financials are based on the most recent Mortgage that was taken out on this home.
Original Mortgage
$83,500
Outstanding Balance
$37,365
Interest Rate
3.57%
Mortgage Type
New Conventional
Estimated Equity
$200,675
Purchase Details
Closed on
Oct 22, 2013
Sold by
Bryan Norma Lee O and Bryan Norma L O
Bought by
Bryan Norma Lee O
Purchase Details
Closed on
Mar 15, 2007
Sold by
Obryan Donald W and Obryan Carrie J
Bought by
Us Bank Na
Purchase Details
Closed on
Jul 23, 1997
Sold by
Shrf Carrie J O'Bryan Pr
Bought by
Comerica Bank
Create a Home Valuation Report for This Property
The Home Valuation Report is an in-depth analysis detailing your home's value as well as a comparison with similar homes in the area
Home Values in the Area
Average Home Value in this Area
Purchase History
| Date | Buyer | Sale Price | Title Company |
|---|---|---|---|
| Obryan Donald | -- | None Available | |
| Jane O Bryan Donald | -- | Servicelink | |
| Bryan Norma Lee O | -- | None Available | |
| Us Bank Na | $108,218 | None Available | |
| Comerica Bank | $65,791 | -- |
Source: Public Records
Mortgage History
| Date | Status | Borrower | Loan Amount |
|---|---|---|---|
| Open | Jane O Bryan Donald | $83,500 |
Source: Public Records
Tax History Compared to Growth
Tax History
| Year | Tax Paid | Tax Assessment Tax Assessment Total Assessment is a certain percentage of the fair market value that is determined by local assessors to be the total taxable value of land and additions on the property. | Land | Improvement |
|---|---|---|---|---|
| 2025 | $1,474 | $106,200 | $0 | $0 |
| 2024 | $1,474 | $97,400 | $0 | $0 |
| 2023 | $1,407 | $91,900 | $0 | $0 |
| 2022 | $2,470 | $81,200 | $0 | $0 |
| 2021 | $2,399 | $78,000 | $0 | $0 |
| 2019 | $2,302 | $69,000 | $0 | $0 |
| 2018 | $1,189 | $67,900 | $0 | $0 |
| 2017 | $2,105 | $66,300 | $0 | $0 |
| 2016 | $3,168 | $65,400 | $0 | $0 |
| 2015 | $5,337 | $62,900 | $0 | $0 |
| 2012 | -- | $51,710 | $27,000 | $24,710 |
Source: Public Records
Map
Nearby Homes
- 18071 Floral St
- 18001 Floral St
- 18061 Lathers St
- 18206 Foch St
- 18404 Deering St
- 18411 Foch St
- 27427 Vargo St
- 18913 Gillman St
- 18884 Lathers St
- 18570 Pershing St
- 18626 Inkster Rd
- 29507 Mark Ln
- 17612 Denby
- 27030 W 6 Mile Rd
- 18851 Poinciana
- 29560 Clarita St Unit 11
- 19169 Inkster Rd
- 29836 Bobrich St
- 29721 Pickford St
- 18690 Fox
- 18130 Lathers St
- 18072 Lathers St
- 18052 Lathers St
- 18111 Floral St
- 18091 Floral St
- 18133 Floral St
- 18161 Floral St
- 18170 Lathers St
- 18024 Lathers St
- 18051 Floral St
- 18101 Lathers St
- 18133 Lathers St
- 18181 Floral St
- 18027 Floral St
- 18161 Lathers St
- 17990 Lathers St
- 18027 Lathers St
- 18171 Lathers St
- 18172 Lathers St
- 18111 Lathers St