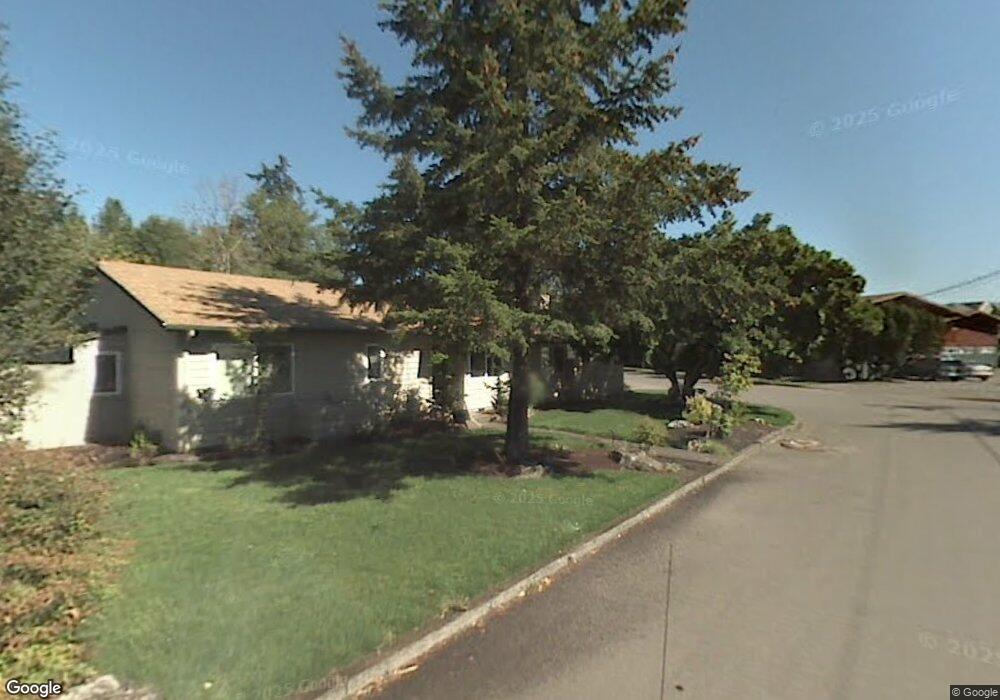
181 3rd St Lake Oswego, OR 97034
Evergreen NeighborhoodEstimated Value: $874,000 - $1,088,000
--
Bed
2
Baths
1,523
Sq Ft
$646/Sq Ft
Est. Value
About This Home
This home is located at 181 3rd St, Lake Oswego, OR 97034 and is currently estimated at $983,927, approximately $646 per square foot. 181 3rd St is a home located in Clackamas County with nearby schools including Forest Hills Elementary School, Lake Oswego Junior High School, and Lake Oswego Senior High School.
Ownership History
Date
Name
Owned For
Owner Type
Purchase Details
Closed on
Jun 28, 2019
Sold by
Norton Kristy L
Bought by
Sosa Julio R and Julio R Sosa 2007 Revocable Tr
Current Estimated Value
Home Financials for this Owner
Home Financials are based on the most recent Mortgage that was taken out on this home.
Original Mortgage
$648,000
Outstanding Balance
$567,397
Interest Rate
4%
Mortgage Type
New Conventional
Estimated Equity
$416,530
Purchase Details
Closed on
Aug 26, 2009
Sold by
Davis Scott M and Davis Keri L
Bought by
Norton Kristy L
Home Financials for this Owner
Home Financials are based on the most recent Mortgage that was taken out on this home.
Original Mortgage
$552,450
Interest Rate
5.09%
Mortgage Type
Commercial
Purchase Details
Closed on
Mar 20, 2002
Sold by
Davis Scott M
Bought by
Davis Scott M and Davis Keri L
Home Financials for this Owner
Home Financials are based on the most recent Mortgage that was taken out on this home.
Original Mortgage
$319,000
Interest Rate
4.25%
Mortgage Type
Commercial
Create a Home Valuation Report for This Property
The Home Valuation Report is an in-depth analysis detailing your home's value as well as a comparison with similar homes in the area
Home Values in the Area
Average Home Value in this Area
Purchase History
| Date | Buyer | Sale Price | Title Company |
|---|---|---|---|
| Sosa Julio R | $810,000 | Wfg Title | |
| Norton Kristy L | $635,000 | Fidelity Natl Title Co Of Or | |
| Davis Scott M | -- | Oregon Title Insurance Co |
Source: Public Records
Mortgage History
| Date | Status | Borrower | Loan Amount |
|---|---|---|---|
| Open | Sosa Julio R | $648,000 | |
| Previous Owner | Norton Kristy L | $552,450 | |
| Previous Owner | Davis Scott M | $319,000 |
Source: Public Records
Tax History Compared to Growth
Tax History
| Year | Tax Paid | Tax Assessment Tax Assessment Total Assessment is a certain percentage of the fair market value that is determined by local assessors to be the total taxable value of land and additions on the property. | Land | Improvement |
|---|---|---|---|---|
| 2025 | $11,411 | $595,517 | -- | -- |
| 2024 | $11,107 | $578,172 | -- | -- |
| 2023 | $11,107 | $561,333 | $0 | $0 |
| 2022 | $10,167 | $529,669 | $0 | $0 |
| 2021 | $9,389 | $514,242 | $0 | $0 |
| 2020 | $9,154 | $499,265 | $0 | $0 |
| 2019 | $8,928 | $484,724 | $0 | $0 |
| 2018 | $8,490 | $470,606 | $0 | $0 |
| 2017 | $8,192 | $456,899 | $0 | $0 |
| 2016 | $7,457 | $443,591 | $0 | $0 |
| 2015 | $7,019 | $430,671 | $0 | $0 |
| 2014 | $6,624 | $418,127 | $0 | $0 |
Source: Public Records
Map
Nearby Homes