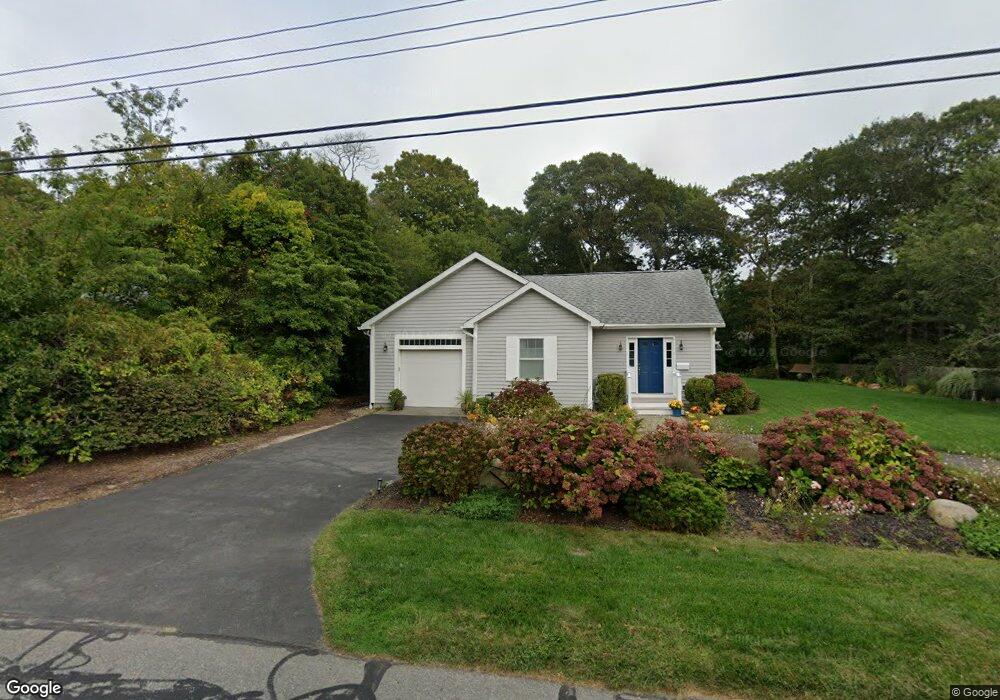
181 Alcott Rd East Falmouth, MA 02536
Estimated Value: $856,317 - $943,000
3
Beds
2
Baths
1,573
Sq Ft
$573/Sq Ft
Est. Value
About This Home
This home is located at 181 Alcott Rd, East Falmouth, MA 02536 and is currently estimated at $901,579, approximately $573 per square foot. 181 Alcott Rd is a home located in Barnstable County with nearby schools including Teaticket Elementary School, Morse Pond School, and Lawrence School.
Ownership History
Date
Name
Owned For
Owner Type
Purchase Details
Closed on
May 24, 2018
Sold by
Sweeney Richard E and Sweeney Patricia A
Bought by
Patricia A Sweeney Ft and Regen
Current Estimated Value
Purchase Details
Closed on
Apr 5, 2010
Sold by
Garden Street T and Sweeney
Bought by
Sweeney Richard E and Sweeney Patricia A
Purchase Details
Closed on
May 20, 1981
Bought by
Sweeney Richard E and Sweeney Patricia A
Create a Home Valuation Report for This Property
The Home Valuation Report is an in-depth analysis detailing your home's value as well as a comparison with similar homes in the area
Home Values in the Area
Average Home Value in this Area
Purchase History
| Date | Buyer | Sale Price | Title Company |
|---|---|---|---|
| Patricia A Sweeney Ft | -- | -- | |
| Patricia A Sweeney Ft | -- | -- | |
| Sweeney Richard E | -- | -- | |
| Sweeney Richard E | -- | -- | |
| Sweeney Richard E | -- | -- |
Source: Public Records
Tax History Compared to Growth
Tax History
| Year | Tax Paid | Tax Assessment Tax Assessment Total Assessment is a certain percentage of the fair market value that is determined by local assessors to be the total taxable value of land and additions on the property. | Land | Improvement |
|---|---|---|---|---|
| 2025 | $4,526 | $771,000 | $307,700 | $463,300 |
| 2024 | $4,333 | $690,000 | $267,900 | $422,100 |
| 2023 | $3,987 | $576,200 | $214,300 | $361,900 |
| 2022 | $4,093 | $508,400 | $200,400 | $308,000 |
| 2021 | $3,918 | $460,900 | $200,400 | $260,500 |
| 2020 | $3,803 | $442,700 | $182,200 | $260,500 |
| 2019 | $3,669 | $428,600 | $182,200 | $246,400 |
| 2018 | $3,601 | $415,300 | $182,200 | $233,100 |
| 2017 | $3,454 | $404,900 | $182,200 | $222,700 |
| 2016 | $3,389 | $404,900 | $182,200 | $222,700 |
| 2015 | $3,316 | $404,900 | $182,200 | $222,700 |
| 2014 | $3,283 | $402,800 | $182,300 | $220,500 |
Source: Public Records
Map
Nearby Homes