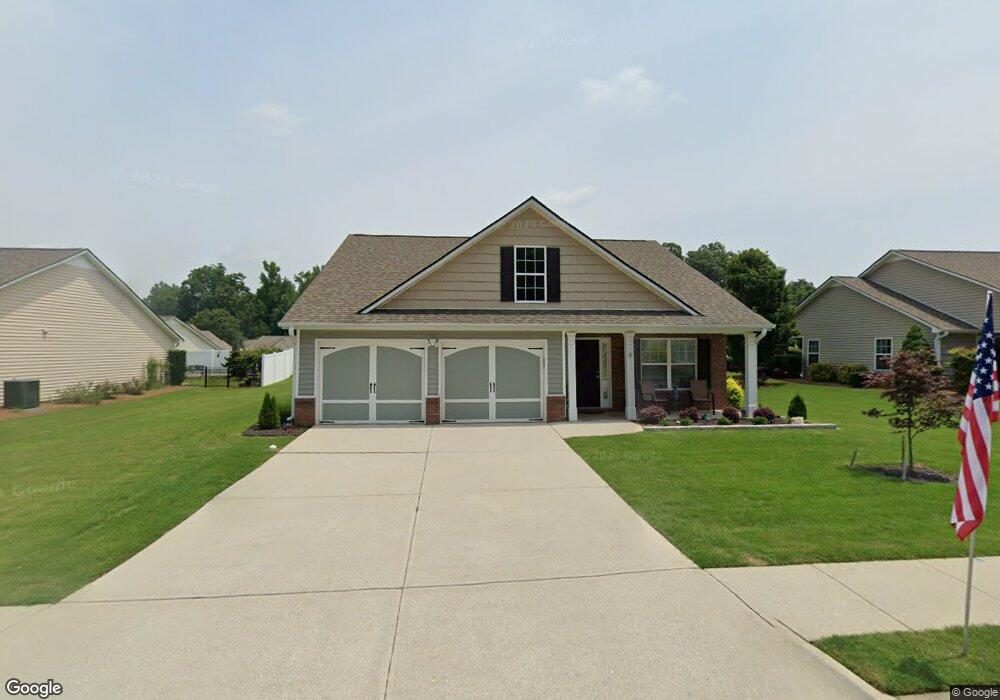
181 Briarcrest Dr Jefferson, GA 30549
Estimated Value: $298,000 - $329,000
Studio
2
Baths
1,366
Sq Ft
$234/Sq Ft
Est. Value
About This Home
This home is located at 181 Briarcrest Dr, Jefferson, GA 30549 and is currently estimated at $319,216, approximately $233 per square foot. 181 Briarcrest Dr is a home located in Jackson County with nearby schools including Jefferson Elementary School, Jefferson Academy, and Jefferson Middle School.
Ownership History
Date
Name
Owned For
Owner Type
Purchase Details
Closed on
Apr 30, 2024
Sold by
Webster Janell Sue
Bought by
Janell Webster Revocable Living Trust
Current Estimated Value
Purchase Details
Closed on
May 29, 2020
Sold by
Krumbach Ronald John
Bought by
Webster Janell Sue
Purchase Details
Closed on
May 15, 2008
Sold by
Meridian Homes At Briarcre
Bought by
Krumbach Marvel May
Home Financials for this Owner
Home Financials are based on the most recent Mortgage that was taken out on this home.
Original Mortgage
$80,000
Interest Rate
5.86%
Mortgage Type
New Conventional
Purchase Details
Closed on
May 19, 2005
Sold by
Oconee Associates Llc
Bought by
Meridian Homes At and Meridian Briarcrest L
Purchase Details
Closed on
Mar 23, 2005
Sold by
Oconee Associates Llc
Bought by
Meridian Homes At Briarcrest Llc
Create a Home Valuation Report for This Property
The Home Valuation Report is an in-depth analysis detailing your home's value as well as a comparison with similar homes in the area
Home Values in the Area
Average Home Value in this Area
Purchase History
| Date | Buyer | Sale Price | Title Company |
|---|---|---|---|
| Janell Webster Revocable Living Trust | -- | -- | |
| Webster Janell Sue | $175,000 | -- | |
| Krumbach Marvel May | $130,000 | -- | |
| Meridian Homes At | $3,695,400 | -- | |
| Meridian Homes At Briarcrest Llc | $42,500 | -- |
Source: Public Records
Mortgage History
| Date | Status | Borrower | Loan Amount |
|---|---|---|---|
| Previous Owner | Krumbach Marvel May | $80,000 |
Source: Public Records
Tax History
| Year | Tax Paid | Tax Assessment Tax Assessment Total Assessment is a certain percentage of the fair market value that is determined by local assessors to be the total taxable value of land and additions on the property. | Land | Improvement |
|---|---|---|---|---|
| 2024 | $1,388 | $115,160 | $40,000 | $75,160 |
| 2023 | $2,379 | $80,840 | $20,000 | $60,840 |
| 2022 | $1,456 | $71,760 | $20,000 | $51,760 |
| 2021 | $1,279 | $65,360 | $13,600 | $51,760 |
| 2020 | $1,054 | $55,800 | $13,600 | $42,200 |
| 2019 | $1,080 | $55,800 | $13,600 | $42,200 |
| 2018 | $1,021 | $53,760 | $13,600 | $40,160 |
| 2017 | $902 | $50,038 | $13,600 | $36,438 |
| 2016 | $909 | $50,038 | $13,600 | $36,438 |
| 2015 | $721 | $41,046 | $8,000 | $33,046 |
| 2014 | $707 | $40,016 | $8,000 | $32,016 |
| 2013 | -- | $40,016 | $8,000 | $32,016 |
Source: Public Records
Map
Nearby Homes
- 175 Thornberry Ln
- 55 Haddington Ct Unit 77
- 55 Haddington Ct
- 38 Jameston Dr
- 104 Jameston Dr
- 420 Andrew Ridge Dr
- 332 Jameston Dr
- 332 Jameston Dr Unit 28
- 594 Paxton Ln
- 175 Paxton Ln
- 581 Rachel View Ct
- 461 Paxton Ln
- 520 Virginia Ave
- 354 Paxton Ln
- 3341 Winder Hwy
- Hayden Plan at Jackson Landing
- Halton Plan at Jackson Landing
- Cali Plan at Jackson Landing
- Denton Plan at Jackson Landing
- Galen Plan at Jackson Landing
- 165 Briarcrest Dr
- 197 Briarcrest Dr
- 153 Thornberry Ln
- 137 Thornberry Ln
- 137 Thornberry Ln Unit 58
- 176 Briarcrest Dr Unit 1
- 176 Briarcrest Dr Unit 17
- 176 Briarcrest Dr
- 160 Briarcrest Dr
- 163 Thornberry Ln
- 192 Briarcrest Dr
- 213 Briarcrest Dr
- 149 Briarcrest Dr
- 121 Thornberry Ln Unit 1
- 121 Thornberry Ln
- 210 Briarcrest Dr
- 103 Thornberry Ln
- 103 Thornberry Ln Unit 60
- 229 Briarcrest Dr
- 146 Briarcrest Dr
Your Personal Tour Guide
Ask me questions while you tour the home.