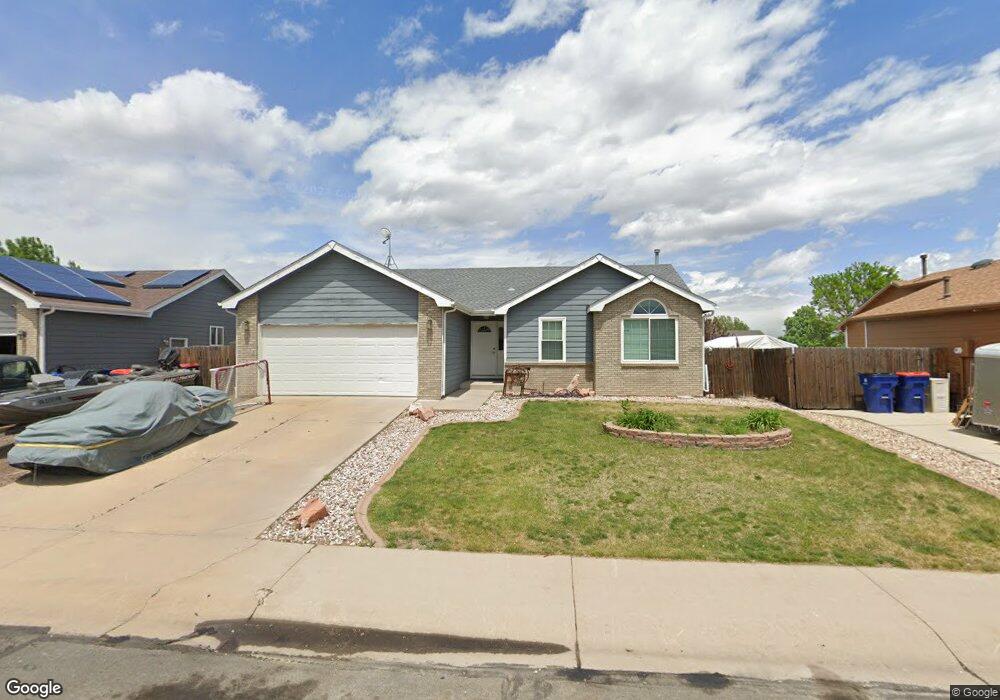
181 E Lilac St Milliken, CO 80543
Estimated Value: $400,220 - $431,000
3
Beds
2
Baths
1,168
Sq Ft
$359/Sq Ft
Est. Value
About This Home
This home is located at 181 E Lilac St, Milliken, CO 80543 and is currently estimated at $419,055, approximately $358 per square foot. 181 E Lilac St is a home located in Weld County with nearby schools including Milliken Elementary School, Milliken Middle School, and Roosevelt High School.
Ownership History
Date
Name
Owned For
Owner Type
Purchase Details
Closed on
Jul 29, 2024
Sold by
Boyer Daniel C and Shaffer Shoshawna L
Bought by
Boyer Daniel C and Boyer Shoshawna L
Current Estimated Value
Home Financials for this Owner
Home Financials are based on the most recent Mortgage that was taken out on this home.
Original Mortgage
$243,182
Outstanding Balance
$239,542
Interest Rate
6.87%
Mortgage Type
FHA
Estimated Equity
$179,513
Purchase Details
Closed on
Jun 23, 1999
Sold by
Bruso Homes Inc
Bought by
Boyer Daniel C and Shaffer Shoshawna L
Home Financials for this Owner
Home Financials are based on the most recent Mortgage that was taken out on this home.
Original Mortgage
$121,300
Interest Rate
7.11%
Purchase Details
Closed on
Mar 17, 1999
Sold by
Wal Mar Third Llc
Bought by
Bruso Homes Inc
Home Financials for this Owner
Home Financials are based on the most recent Mortgage that was taken out on this home.
Original Mortgage
$99,240
Interest Rate
6.74%
Mortgage Type
Construction
Create a Home Valuation Report for This Property
The Home Valuation Report is an in-depth analysis detailing your home's value as well as a comparison with similar homes in the area
Home Values in the Area
Average Home Value in this Area
Purchase History
| Date | Buyer | Sale Price | Title Company |
|---|---|---|---|
| Boyer Daniel C | -- | None Listed On Document | |
| Boyer Daniel C | $132,500 | -- | |
| Bruso Homes Inc | $27,000 | Land Title |
Source: Public Records
Mortgage History
| Date | Status | Borrower | Loan Amount |
|---|---|---|---|
| Open | Boyer Daniel C | $243,182 | |
| Previous Owner | Boyer Daniel C | $121,300 | |
| Previous Owner | Bruso Homes Inc | $99,240 | |
| Closed | Bruso Homes Inc | $18,475 |
Source: Public Records
Tax History
| Year | Tax Paid | Tax Assessment Tax Assessment Total Assessment is a certain percentage of the fair market value that is determined by local assessors to be the total taxable value of land and additions on the property. | Land | Improvement |
|---|---|---|---|---|
| 2025 | $2,267 | $25,880 | $5,880 | $20,000 |
| 2024 | $2,267 | $25,880 | $5,880 | $20,000 |
| 2023 | $2,315 | $26,870 | $5,410 | $21,460 |
| 2022 | $2,455 | $21,010 | $4,380 | $16,630 |
| 2021 | $2,651 | $21,610 | $4,500 | $17,110 |
| 2020 | $2,395 | $19,940 | $3,580 | $16,360 |
| 2019 | $1,880 | $19,940 | $3,580 | $16,360 |
| 2018 | $1,577 | $16,340 | $2,810 | $13,530 |
| 2017 | $1,578 | $16,340 | $2,810 | $13,530 |
| 2016 | $1,375 | $14,100 | $2,270 | $11,830 |
| 2015 | $1,397 | $14,100 | $2,270 | $11,830 |
| 2014 | $972 | $9,920 | $2,390 | $7,530 |
Source: Public Records
Map
Nearby Homes
- 280 E Katsura St
- 320 E Lilac St
- 831 S Norma Ave
- 941 S Rachel Ave
- 831 S Rachel Ave
- 1130 S Marjorie Ave
- 303 W Juneberry St
- 206 S Quentine Ave
- 1303 S Harvester Dr
- 1530 S Haymaker Dr
- 1364 S Growers Dr
- 1384 S Growers Dr
- 106 N Quentine Ave
- 0 Broad St Unit REC8059102
- 1576 S Frances Ave
- 113 S Frances Ave
- 0 S Cora Ave
- 1305 S Cattleman Dr
- 1455 S Cattleman Dr
- 102 Aragon Ct
- 161 E Lilac St
- 160 Katsura Cir
- 141 E Lilac St
- 150 Katsura Cir
- 170 Katsura Cir
- 160 E Lilac St
- 180 E Lilac St
- 140 Katsura Cir
- 200 E Lilac St
- 121 E Lilac St
- 221 E Lilac St
- 130 Katsura Cir
- 901 S Olive Ave
- 120 E Lilac St
- 101 E Lilac St
- 220 E Lilac St
- 120 Katsura Cir
- 241 E Lilac St
- 100 E Lilac St
- 240 E Katsura St
Your Personal Tour Guide
Ask me questions while you tour the home.