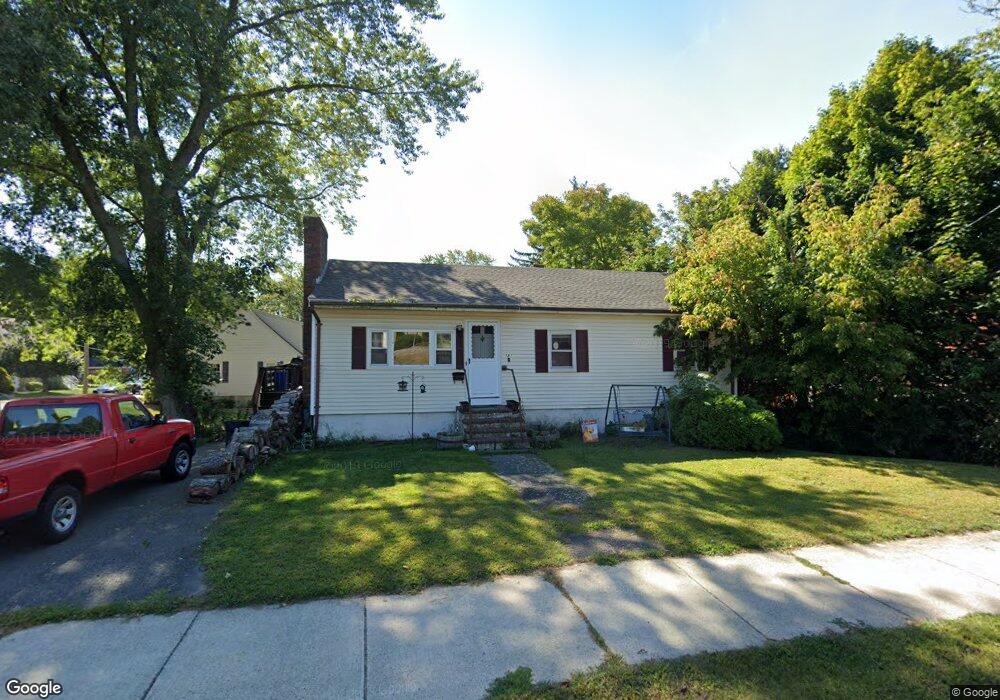
181 Elliott St Danvers, MA 01923
Estimated Value: $520,000 - $655,000
3
Beds
1
Bath
960
Sq Ft
$613/Sq Ft
Est. Value
About This Home
This home is located at 181 Elliott St, Danvers, MA 01923 and is currently estimated at $588,188, approximately $612 per square foot. 181 Elliott St is a home located in Essex County with nearby schools including The Saints Academy and Mrs Alexander's School.
Ownership History
Date
Name
Owned For
Owner Type
Purchase Details
Closed on
Jan 19, 2024
Sold by
Elliott Street Rt and Conway
Bought by
Connors Shannon A
Current Estimated Value
Home Financials for this Owner
Home Financials are based on the most recent Mortgage that was taken out on this home.
Original Mortgage
$268,850
Outstanding Balance
$263,722
Interest Rate
7.03%
Mortgage Type
Purchase Money Mortgage
Estimated Equity
$324,466
Purchase Details
Closed on
Aug 26, 2002
Sold by
Defrancisco Alan R
Bought by
Comb William C and Comb Joanne L
Home Financials for this Owner
Home Financials are based on the most recent Mortgage that was taken out on this home.
Original Mortgage
$83,000
Interest Rate
6.57%
Mortgage Type
Purchase Money Mortgage
Purchase Details
Closed on
Apr 30, 1996
Sold by
Northerly Parcel Nt and Lutkus
Bought by
New Horizons Beverly
Create a Home Valuation Report for This Property
The Home Valuation Report is an in-depth analysis detailing your home's value as well as a comparison with similar homes in the area
Home Values in the Area
Average Home Value in this Area
Purchase History
| Date | Buyer | Sale Price | Title Company |
|---|---|---|---|
| Connors Shannon A | $283,000 | None Available | |
| Comb William C | $283,000 | -- | |
| New Horizons Beverly | $200,000 | -- | |
| Beverly Commerce Pk | $300,000 | -- |
Source: Public Records
Mortgage History
| Date | Status | Borrower | Loan Amount |
|---|---|---|---|
| Open | Connors Shannon A | $268,850 | |
| Previous Owner | Beverly Commerce Pk | $83,000 | |
| Previous Owner | Beverly Commerce Pk | $95,000 |
Source: Public Records
Tax History Compared to Growth
Tax History
| Year | Tax Paid | Tax Assessment Tax Assessment Total Assessment is a certain percentage of the fair market value that is determined by local assessors to be the total taxable value of land and additions on the property. | Land | Improvement |
|---|---|---|---|---|
| 2025 | $5,180 | $471,300 | $308,100 | $163,200 |
| 2024 | $5,215 | $469,400 | $308,100 | $161,300 |
| 2023 | $4,973 | $423,200 | $273,200 | $150,000 |
| 2022 | $4,739 | $374,300 | $238,300 | $136,000 |
| 2021 | $4,407 | $330,100 | $216,200 | $113,900 |
| 2020 | $4,221 | $323,200 | $209,300 | $113,900 |
| 2019 | $4,199 | $316,200 | $202,300 | $113,900 |
| 2018 | $4,021 | $297,000 | $196,500 | $100,500 |
| 2017 | $3,994 | $281,500 | $182,500 | $99,000 |
| 2016 | $3,810 | $268,300 | $174,400 | $93,900 |
| 2015 | $3,553 | $238,300 | $151,100 | $87,200 |
Source: Public Records
Map
Nearby Homes
- 508 Elliott St
- 59 Riverview Ave
- 117 Elliott St
- 13 Giles Ave Unit 2
- 24 Western Ave
- 81 Elliott St
- 166 High St
- 4 Wayside Dr
- 26 Bates St
- 38 Matthies St
- 9 Endicott St Unit B
- 24 Amherst Rd
- 123 Livingstone Ave
- 140 Livingstone Ave
- 50 Balch St Unit 205
- 100 Poplar St
- 24 Purchase St
- 46 Winthrop Ave
- 52 Ellsworth Ave
- 86 Abington Rd Unit 86