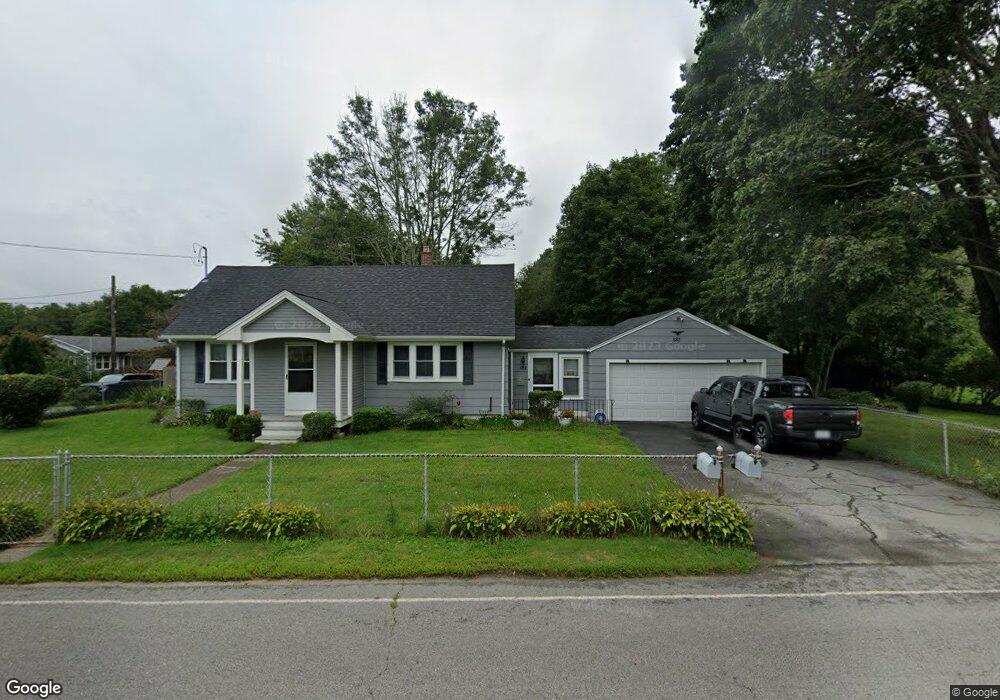
181 Gifford Rd Westport, MA 02790
North Westport NeighborhoodEstimated Value: $499,000 - $576,000
3
Beds
--
Bath
1,918
Sq Ft
$275/Sq Ft
Est. Value
About This Home
This home is located at 181 Gifford Rd, Westport, MA 02790 and is currently estimated at $527,292, approximately $274 per square foot. 181 Gifford Rd is a home located in Bristol County with nearby schools including Alice A. Macomber Primary School, Westport Elementary School, and Westport Middle-High School.
Ownership History
Date
Name
Owned For
Owner Type
Purchase Details
Closed on
Mar 16, 2015
Sold by
Desrosier Rose A and Live Well Financial In
Bought by
Gardner David P
Current Estimated Value
Home Financials for this Owner
Home Financials are based on the most recent Mortgage that was taken out on this home.
Original Mortgage
$135,280
Outstanding Balance
$103,573
Interest Rate
3.67%
Mortgage Type
New Conventional
Estimated Equity
$423,719
Create a Home Valuation Report for This Property
The Home Valuation Report is an in-depth analysis detailing your home's value as well as a comparison with similar homes in the area
Home Values in the Area
Average Home Value in this Area
Purchase History
| Date | Buyer | Sale Price | Title Company |
|---|---|---|---|
| Gardner David P | $169,100 | -- |
Source: Public Records
Mortgage History
| Date | Status | Borrower | Loan Amount |
|---|---|---|---|
| Open | Gardner David P | $135,280 |
Source: Public Records
Tax History Compared to Growth
Tax History
| Year | Tax Paid | Tax Assessment Tax Assessment Total Assessment is a certain percentage of the fair market value that is determined by local assessors to be the total taxable value of land and additions on the property. | Land | Improvement |
|---|---|---|---|---|
| 2025 | $2,961 | $397,500 | $174,000 | $223,500 |
| 2024 | $2,886 | $373,300 | $154,500 | $218,800 |
| 2023 | $2,858 | $350,300 | $140,700 | $209,600 |
| 2022 | $2,703 | $318,800 | $140,700 | $178,100 |
| 2021 | $2,538 | $294,400 | $116,300 | $178,100 |
| 2020 | $2,442 | $289,700 | $111,600 | $178,100 |
| 2019 | $2,198 | $265,800 | $111,600 | $154,200 |
| 2018 | $1,844 | $225,700 | $112,600 | $113,100 |
| 2017 | $1,784 | $223,900 | $109,000 | $114,900 |
| 2016 | $1,743 | $220,300 | $105,400 | $114,900 |
| 2015 | $1,731 | $218,300 | $107,800 | $110,500 |
Source: Public Records
Map
Nearby Homes