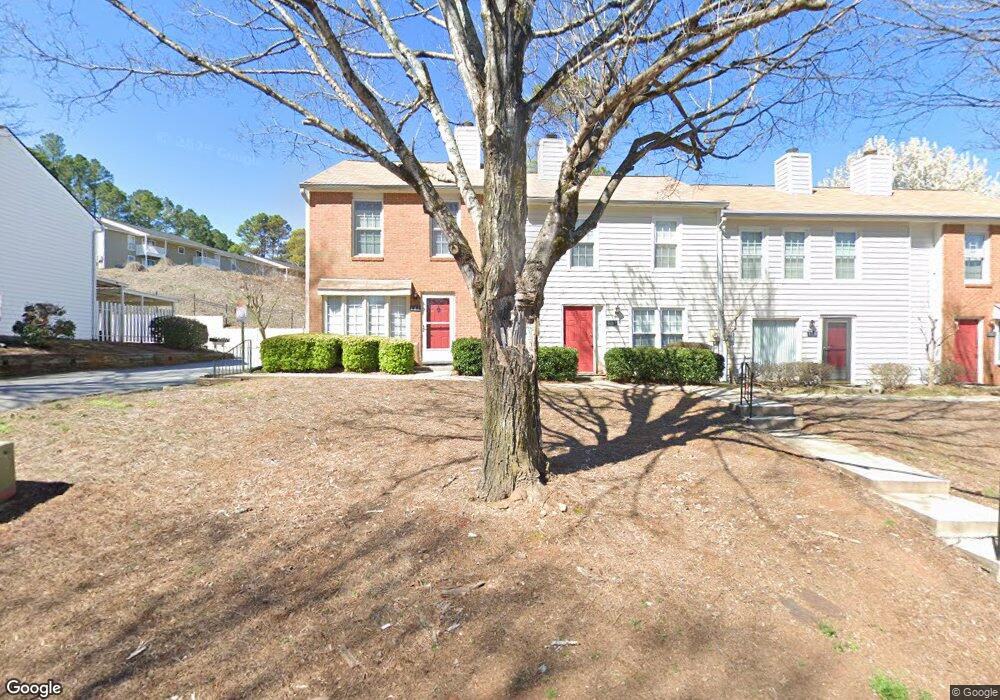
181 High Creek Dr Roswell, GA 30076
Estimated Value: $259,000 - $277,000
2
Beds
3
Baths
1,240
Sq Ft
$215/Sq Ft
Est. Value
About This Home
This home is located at 181 High Creek Dr, Roswell, GA 30076 and is currently estimated at $266,200, approximately $214 per square foot. 181 High Creek Dr is a home located in Fulton County with nearby schools including Mimosa Elementary School, Haynes Bridge Middle School, and Centennial High School.
Ownership History
Date
Name
Owned For
Owner Type
Purchase Details
Closed on
Mar 16, 2018
Sold by
Zhijie Xia
Bought by
Dma Holdings Llc
Current Estimated Value
Purchase Details
Closed on
Jul 14, 2010
Sold by
Aurora Ln Svcs Llc
Bought by
Xia Zhijie
Purchase Details
Closed on
May 4, 2010
Sold by
Brown Kimberly
Bought by
Aurora Ln Svcs
Purchase Details
Closed on
Jul 21, 2006
Sold by
Hensel Mary
Bought by
Brown Kimberly
Home Financials for this Owner
Home Financials are based on the most recent Mortgage that was taken out on this home.
Original Mortgage
$94,900
Interest Rate
6.68%
Mortgage Type
New Conventional
Purchase Details
Closed on
Apr 30, 1997
Sold by
Lenci Julie A
Bought by
Hensel Mary
Home Financials for this Owner
Home Financials are based on the most recent Mortgage that was taken out on this home.
Original Mortgage
$62,200
Interest Rate
8.2%
Mortgage Type
VA
Create a Home Valuation Report for This Property
The Home Valuation Report is an in-depth analysis detailing your home's value as well as a comparison with similar homes in the area
Home Values in the Area
Average Home Value in this Area
Purchase History
| Date | Buyer | Sale Price | Title Company |
|---|---|---|---|
| Dma Holdings Llc | $105,000 | -- | |
| Xia Zhijie | $48,000 | -- | |
| Aurora Ln Svcs | $109,120 | -- | |
| Brown Kimberly | $94,900 | -- | |
| Hensel Mary | $61,000 | -- |
Source: Public Records
Mortgage History
| Date | Status | Borrower | Loan Amount |
|---|---|---|---|
| Previous Owner | Brown Kimberly | $94,900 | |
| Previous Owner | Hensel Mary | $62,200 |
Source: Public Records
Tax History Compared to Growth
Tax History
| Year | Tax Paid | Tax Assessment Tax Assessment Total Assessment is a certain percentage of the fair market value that is determined by local assessors to be the total taxable value of land and additions on the property. | Land | Improvement |
|---|---|---|---|---|
| 2025 | $550 | $96,400 | $17,880 | $78,520 |
| 2023 | $2,828 | $100,200 | $15,360 | $84,840 |
| 2022 | $2,241 | $85,160 | $15,280 | $69,880 |
| 2021 | $2,149 | $67,480 | $8,520 | $58,960 |
| 2020 | $1,974 | $60,280 | $9,400 | $50,880 |
| 2019 | $208 | $42,000 | $4,520 | $37,480 |
| 2018 | $1,156 | $40,960 | $5,160 | $35,800 |
| 2017 | $889 | $30,480 | $4,040 | $26,440 |
| 2016 | $890 | $30,480 | $4,040 | $26,440 |
| 2015 | $599 | $30,480 | $4,040 | $26,440 |
| 2014 | $528 | $17,240 | $4,880 | $12,360 |
Source: Public Records
Map
Nearby Homes
- 223 High Creek Dr Unit 3A
- 238 Chads Ford Way
- 237 Chads Ford Way
- 222 Mill Creek Place
- 151 Old Ferry Way
- 1016 Old Holcomb Bridge Rd
- 988 Old Holcomb Bridge Rd
- 992 Old Holcomb Bridge Rd
- 425 Worthington Hills Ct
- Washington Plan at Ivanhoe - Liberty Series
- 10630 Worthington Hills Manor
- 420 Old Holcomb Bridge Rd
- 146 Willow Stream Ct
- 2046 Heathermere Way
- 1048 Merrivale Chase Ln
- 155 Willow Stream Ct
- 1063 Merrivale Chase Ln
- 1210 Roswell Manor Cir
- 179 High Creek Dr
- 183 High Creek Dr
- 185 High Creek Dr Unit 3B
- 177 High Creek Dr
- 187 High Creek Dr
- 187 High Creek Dr
- 415 High Creek Trace
- 0 High Creek Trace Unit 7107501
- 0 High Creek Trace
- 188 High Creek Dr Unit 32-A
- 188 High Creek Dr
- 190 High Creek Dr
- 186 High Creek Dr
- 192 High Creek Dr
- 184 High Creek Dr
- 422 High Creek Trace
- 194 High Creek Dr
- 182 High Creek Dr Unit 3B
- 196 High Creek Dr Unit 3B
- 416 High Creek Trace Unit TR