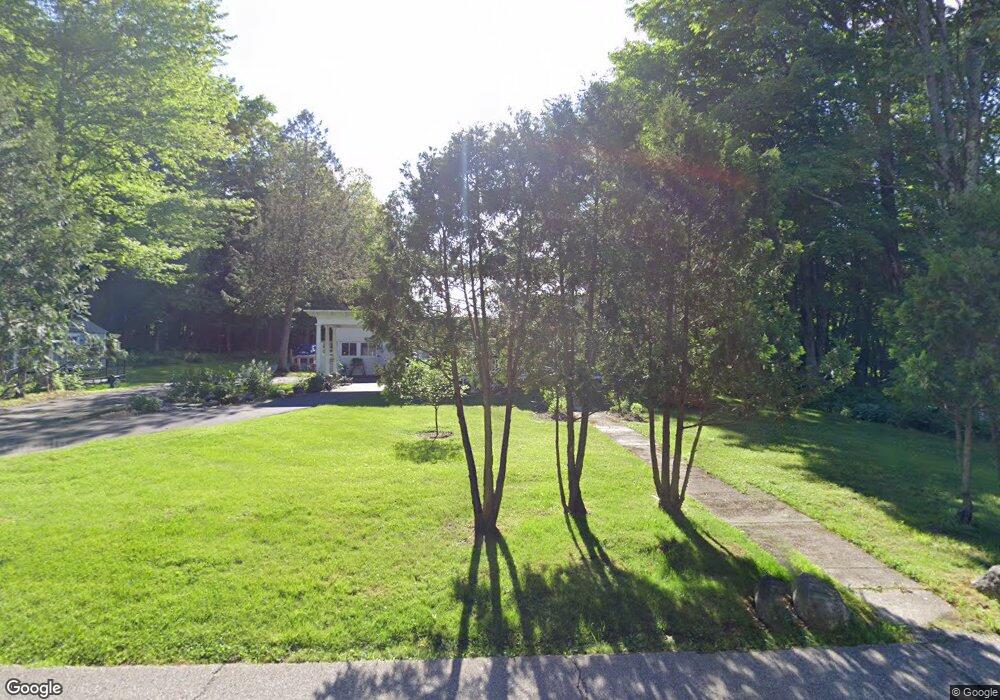
181 Maple St Bethlehem, NH 03574
Estimated Value: $347,073 - $414,000
3
Beds
3
Baths
1,800
Sq Ft
$214/Sq Ft
Est. Value
About This Home
This home is located at 181 Maple St, Bethlehem, NH 03574 and is currently estimated at $385,268, approximately $214 per square foot. 181 Maple St is a home with nearby schools including Bethlehem Elementary School, Profile Junior High School, and Profile Senior High School.
Ownership History
Date
Name
Owned For
Owner Type
Purchase Details
Closed on
Jun 20, 2019
Sold by
Boedecker Heidi and Snitko Christopher J
Bought by
Sullivan Pamela E and Richmond Lee M
Current Estimated Value
Home Financials for this Owner
Home Financials are based on the most recent Mortgage that was taken out on this home.
Original Mortgage
$158,400
Outstanding Balance
$137,225
Interest Rate
4.1%
Estimated Equity
$248,043
Purchase Details
Closed on
Nov 7, 2016
Sold by
Beleau Olivia C
Bought by
Boedecker Heidi and Snitko Christopher J
Purchase Details
Closed on
Jul 1, 2011
Sold by
Penney Elizabeth A
Bought by
Beleau Olivia C
Home Financials for this Owner
Home Financials are based on the most recent Mortgage that was taken out on this home.
Original Mortgage
$103,550
Interest Rate
4.62%
Mortgage Type
Purchase Money Mortgage
Create a Home Valuation Report for This Property
The Home Valuation Report is an in-depth analysis detailing your home's value as well as a comparison with similar homes in the area
Home Values in the Area
Average Home Value in this Area
Purchase History
We collect this data history from publicly available records. To have your information removed, we recommend requesting removal directly through your county’s website.
| Date | Buyer | Sale Price | Title Company |
|---|---|---|---|
| Sullivan Pamela E | $198,000 | -- | |
| Boedecker Heidi | $126,600 | -- | |
| Beleau Olivia C | $109,000 | -- |
Source: Public Records
Mortgage History
We collect this data history from publicly available records. To have your information removed, we recommend requesting removal directly through your county’s website.
| Date | Status | Borrower | Loan Amount |
|---|---|---|---|
| Open | Sullivan Pamela E | $158,400 | |
| Previous Owner | Beleau Olivia C | $103,550 | |
| Previous Owner | Beleau Olivia C | $52,570 |
Source: Public Records
Tax History
| Year | Tax Paid | Tax Assessment Tax Assessment Total Assessment is a certain percentage of the fair market value that is determined by local assessors to be the total taxable value of land and additions on the property. | Land | Improvement |
|---|---|---|---|---|
| 2025 | $4,876 | $301,200 | $86,300 | $214,900 |
| 2024 | $5,175 | $301,200 | $86,300 | $214,900 |
| 2023 | $4,648 | $301,200 | $86,300 | $214,900 |
| 2022 | $3,220 | $134,800 | $27,000 | $107,800 |
| 2021 | $3,342 | $134,800 | $27,000 | $107,800 |
| 2020 | $2,918 | $115,800 | $27,000 | $88,800 |
| 2019 | $2,681 | $115,800 | $27,000 | $88,800 |
| 2018 | $3,007 | $115,800 | $27,000 | $88,800 |
| 2017 | $2,602 | $105,900 | $30,000 | $75,900 |
| 2016 | $2,908 | $105,900 | $30,000 | $75,900 |
| 2015 | $3,137 | $105,900 | $30,000 | $75,900 |
| 2013 | $3,023 | $105,900 | $30,000 | $75,900 |
Source: Public Records
Map
Nearby Homes
Your Personal Tour Guide
Ask me questions while you tour the home.