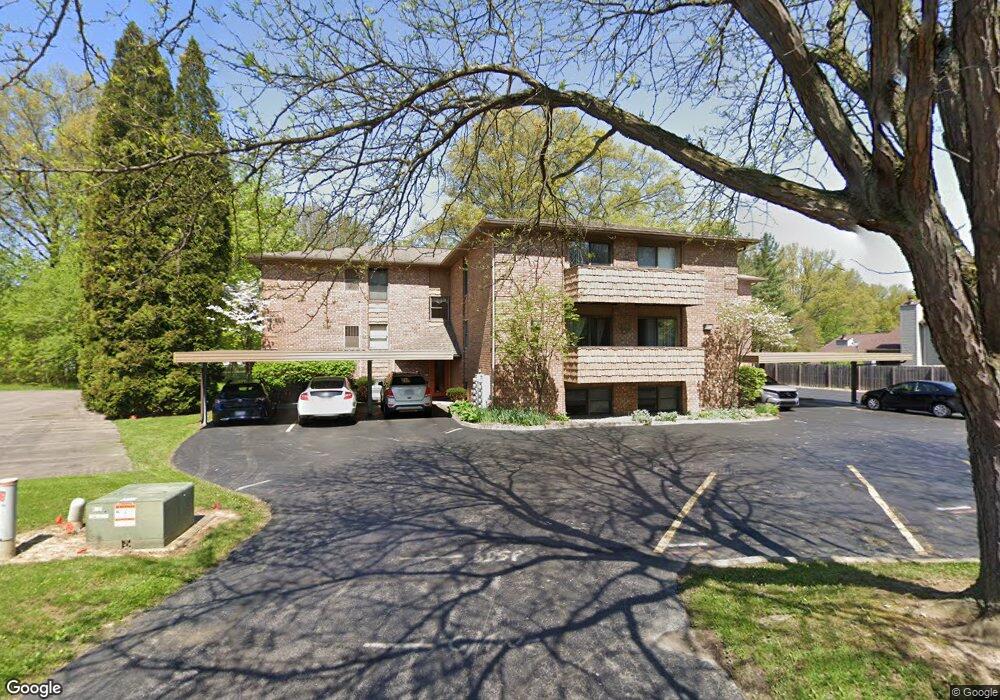
181 Maplewood Dr Unit 8 Cortland, OH 44410
Estimated Value: $79,000 - $123,000
2
Beds
1
Bath
923
Sq Ft
$109/Sq Ft
Est. Value
About This Home
This home is located at 181 Maplewood Dr Unit 8, Cortland, OH 44410 and is currently estimated at $100,289, approximately $108 per square foot. 181 Maplewood Dr Unit 8 is a home located in Trumbull County with nearby schools including Lakeview Elementary School, Lakeview Middle School, and Lakeview High School.
Ownership History
Date
Name
Owned For
Owner Type
Purchase Details
Closed on
May 11, 2020
Sold by
Castways Rental Properties Llc
Bought by
V T Larney Ltd
Current Estimated Value
Purchase Details
Closed on
Oct 30, 2014
Sold by
Castways Rental Properties Llc
Bought by
Bauer Janice E and Bauer Duane A
Purchase Details
Closed on
Apr 23, 2008
Sold by
Sloan Harry A and Sloan Vickie J
Bought by
Castways Rental Properties Llc
Purchase Details
Closed on
Oct 25, 2007
Sold by
Cator Larry J
Bought by
Sloan Harry A and Sloan Vickie J
Purchase Details
Closed on
Oct 17, 2007
Sold by
Cator Larry J
Bought by
Sloan Harry A and Sloan Vickie J
Purchase Details
Closed on
Apr 18, 1994
Sold by
Bhattacharjee Anjuli
Bought by
Larry J Cator
Purchase Details
Closed on
Jan 1, 1990
Bought by
Anjuli Bhattacharjee
Create a Home Valuation Report for This Property
The Home Valuation Report is an in-depth analysis detailing your home's value as well as a comparison with similar homes in the area
Home Values in the Area
Average Home Value in this Area
Purchase History
| Date | Buyer | Sale Price | Title Company |
|---|---|---|---|
| V T Larney Ltd | $48,000 | None Available | |
| Bauer Janice E | -- | None Available | |
| Castways Rental Properties Llc | -- | Attorney | |
| Sloan Harry A | $48,000 | None Available | |
| Sloan Harry A | $48,000 | None Available | |
| Larry J Cator | $46,000 | -- | |
| Anjuli Bhattacharjee | -- | -- |
Source: Public Records
Tax History Compared to Growth
Tax History
| Year | Tax Paid | Tax Assessment Tax Assessment Total Assessment is a certain percentage of the fair market value that is determined by local assessors to be the total taxable value of land and additions on the property. | Land | Improvement |
|---|---|---|---|---|
| 2024 | $942 | $17,500 | $1,750 | $15,750 |
| 2023 | $942 | $17,500 | $1,750 | $15,750 |
| 2022 | $1,073 | $16,730 | $1,750 | $14,980 |
| 2021 | $1,078 | $16,730 | $1,750 | $14,980 |
| 2020 | $1,083 | $16,730 | $1,750 | $14,980 |
| 2019 | $1,045 | $15,750 | $1,750 | $14,000 |
| 2018 | $1,049 | $15,750 | $1,750 | $14,000 |
| 2017 | $1,048 | $15,750 | $1,750 | $14,000 |
| 2016 | $1,157 | $16,800 | $1,750 | $15,050 |
| 2015 | $1,153 | $16,800 | $1,750 | $15,050 |
| 2014 | $1,018 | $16,800 | $1,750 | $15,050 |
| 2013 | $1,036 | $16,800 | $1,750 | $15,050 |
Source: Public Records
Map
Nearby Homes
- 140 Leckrone Way
- 151 Cedar Cir
- 105 Diamond Way Unit 105
- 104 Diamond Way Unit 104
- 111 Emerald Ln
- 130 Topaz Trail Unit 130
- 278 Rosewae Ave
- 10 Harneds Landing
- 232 Bayview Dr Unit 232
- 3 Harneds Landing Unit 3
- 2 Harneds Landing
- 19 Spring Creek Dr
- 120 Winter Ln
- 155 Heritage Ln
- 220 Wae Trail
- 2 Turnberry Place
- 0 N High St
- 124 Saint Andrews
- 101 Elizabeth Ct
- 2730 Wilson Sharpsville Rd
- 181 Maplewood Dr Unit 12
- 181 Maplewood Dr Unit 11
- 181 Maplewood Dr Unit 10
- 181 Maplewood Dr Unit 9
- 181 Maplewood Dr Unit 7
- 181 Maplewood Dr Unit 6
- 181 Maplewood Dr Unit 5
- 181 Maplewood Dr Unit 4
- 181 Maplewood Dr Unit 3
- 181 Maplewood Dr Unit 2
- 181 Maplewood Dr Unit 1
- 181 Maplewood Dr
- 380 Fowler St
- 350 Fowler St
- 273 Maplewood Dr
- lot #6 Maplewood Dr
- 384 Fowler St Unit 384
- 382 Fowler St
- 346 Fowler St
- 459 Cedar Dr