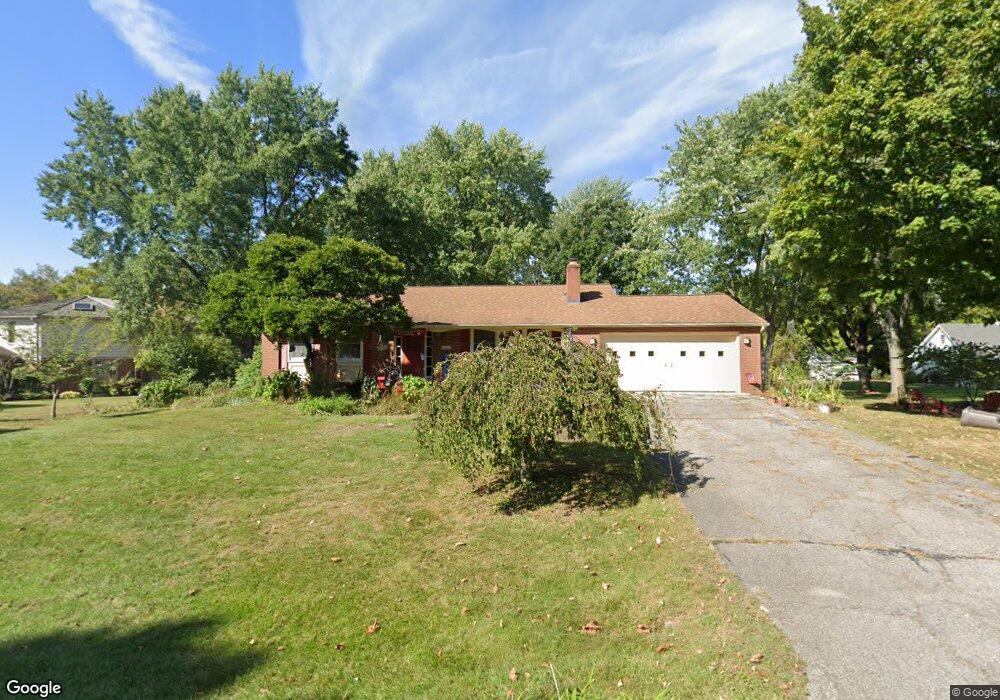
181 Monroe Ln Westerville, OH 43081
Estimated Value: $373,000 - $427,000
4
Beds
2
Baths
1,442
Sq Ft
$276/Sq Ft
Est. Value
About This Home
This home is located at 181 Monroe Ln, Westerville, OH 43081 and is currently estimated at $397,487, approximately $275 per square foot. 181 Monroe Ln is a home located in Franklin County with nearby schools including Whittier Elementary School, Blendon Middle School, and Westerville South High School.
Ownership History
Date
Name
Owned For
Owner Type
Purchase Details
Closed on
Aug 3, 2001
Sold by
Rand Carol M
Bought by
Levine Amy C
Current Estimated Value
Home Financials for this Owner
Home Financials are based on the most recent Mortgage that was taken out on this home.
Original Mortgage
$147,250
Outstanding Balance
$54,195
Interest Rate
6.37%
Mortgage Type
Purchase Money Mortgage
Estimated Equity
$343,292
Purchase Details
Closed on
Jul 27, 2001
Sold by
Rand William E
Bought by
Rand Carol M
Home Financials for this Owner
Home Financials are based on the most recent Mortgage that was taken out on this home.
Original Mortgage
$147,250
Outstanding Balance
$54,195
Interest Rate
6.37%
Mortgage Type
Purchase Money Mortgage
Estimated Equity
$343,292
Purchase Details
Closed on
Oct 31, 1986
Bought by
Rand William E and Rand Carol M
Purchase Details
Closed on
Aug 1, 1983
Create a Home Valuation Report for This Property
The Home Valuation Report is an in-depth analysis detailing your home's value as well as a comparison with similar homes in the area
Home Values in the Area
Average Home Value in this Area
Purchase History
| Date | Buyer | Sale Price | Title Company |
|---|---|---|---|
| Levine Amy C | $155,000 | Amerititle Agency Inc | |
| Rand Carol M | -- | Amerititle Agency Inc | |
| Rand William E | $113,000 | -- | |
| -- | $90,000 | -- |
Source: Public Records
Mortgage History
| Date | Status | Borrower | Loan Amount |
|---|---|---|---|
| Open | Levine Amy C | $147,250 |
Source: Public Records
Tax History Compared to Growth
Tax History
| Year | Tax Paid | Tax Assessment Tax Assessment Total Assessment is a certain percentage of the fair market value that is determined by local assessors to be the total taxable value of land and additions on the property. | Land | Improvement |
|---|---|---|---|---|
| 2024 | $6,861 | $120,720 | $42,000 | $78,720 |
| 2023 | $6,715 | $120,715 | $42,000 | $78,715 |
| 2022 | $5,623 | $77,180 | $47,810 | $29,370 |
| 2021 | $5,670 | $77,180 | $47,810 | $29,370 |
| 2020 | $5,582 | $76,200 | $47,810 | $28,390 |
| 2019 | $5,153 | $66,400 | $47,810 | $18,590 |
| 2018 | $4,701 | $66,400 | $47,810 | $18,590 |
| 2017 | $4,780 | $66,400 | $47,810 | $18,590 |
| 2016 | $4,493 | $53,590 | $18,240 | $35,350 |
| 2015 | $4,352 | $53,590 | $18,240 | $35,350 |
| 2014 | $4,355 | $53,590 | $18,240 | $35,350 |
| 2013 | $2,174 | $53,585 | $18,235 | $35,350 |
Source: Public Records
Map
Nearby Homes
- 417 E Park St
- 360 Potawatomi Dr
- 182 Hillcrest Dr
- 589 E College Ave
- 368 E College Ave
- 364 E College Ave
- 371 Delaware Dr
- 150 Matthew Ave
- 0 Cherrington Rd Unit 225023909
- 192 Buckeye Ct
- 200 Matthew Ave
- 768 Collingwood Dr
- 199 E College Ave
- 539 Cherrington Rd
- 559 Allview Ct
- 466 S State St
- 470 S State St
- 92 N Vine St
- 969 Farrington Dr
- 693 Pointview Dr