Estimated Value: $303,000 - $486,000
--
Bed
--
Bath
1,998
Sq Ft
$193/Sq Ft
Est. Value
About This Home
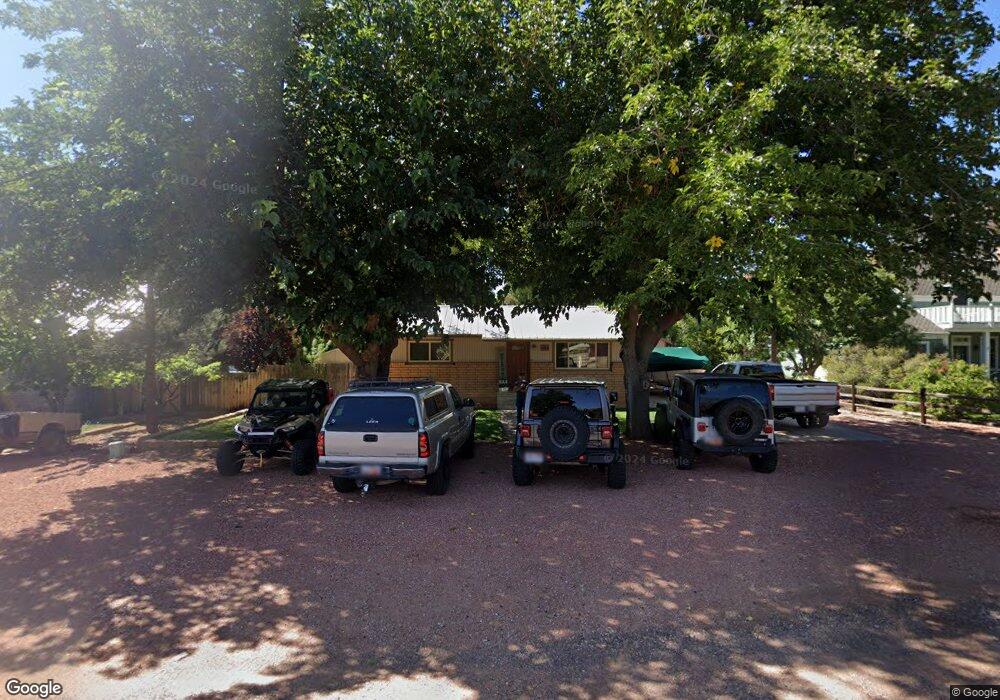
This home is located at 181 N 200 W, Kanab, UT 84741 and is currently estimated at $386,494, approximately $193 per square foot. 181 N 200 W is a home located in Kane County with nearby schools including Kanab Elementary School, Kanab Middle School, and Kanab High School.
Ownership History
Date
Name
Owned For
Owner Type
Purchase Details
Closed on
Oct 17, 2024
Bought by
Jackson Bobbie Sue and Jackson Joseph Dearborn
Current Estimated Value
Purchase Details
Closed on
Jun 15, 2009
Sold by
Ramsay Nick and Ramsay Carol Lynn
Bought by
Ramsay Bobbie Sue
Home Financials for this Owner
Home Financials are based on the most recent Mortgage that was taken out on this home.
Original Mortgage
$104,000
Interest Rate
4.76%
Purchase Details
Closed on
Dec 22, 2006
Sold by
Reverse Exchange Lc
Bought by
Ramsay Nick and Ramsay Carol Lynn
Purchase Details
Closed on
Dec 5, 2005
Sold by
Glover Casey J and Glover Becky L
Bought by
Reverse Exchange Lc
Create a Home Valuation Report for This Property
The Home Valuation Report is an in-depth analysis detailing your home's value as well as a comparison with similar homes in the area
Home Values in the Area
Average Home Value in this Area
Purchase History
| Date | Buyer | Sale Price | Title Company |
|---|---|---|---|
| Jackson Bobbie Sue | -- | -- | |
| Ramsay Bobbie Sue | -- | -- | |
| Ramsay Nick | -- | -- | |
| Reverse Exchange Lc | -- | -- |
Source: Public Records
Mortgage History
| Date | Status | Borrower | Loan Amount |
|---|---|---|---|
| Previous Owner | Ramsay Bobbie Sue | $104,000 |
Source: Public Records
Tax History Compared to Growth
Tax History
| Year | Tax Paid | Tax Assessment Tax Assessment Total Assessment is a certain percentage of the fair market value that is determined by local assessors to be the total taxable value of land and additions on the property. | Land | Improvement |
|---|---|---|---|---|
| 2025 | $1,663 | $188,196 | $55,457 | $132,739 |
| 2024 | $1,663 | $193,209 | $44,661 | $148,548 |
| 2023 | $1,491 | $177,577 | $42,534 | $135,043 |
| 2022 | $1,319 | $155,485 | $32,718 | $122,767 |
| 2021 | $1,193 | $211,102 | $45,760 | $165,342 |
| 2020 | $1,154 | $198,159 | $41,600 | $156,559 |
| 2019 | $1,092 | $182,651 | $43,428 | $139,223 |
| 2018 | $999 | $165,704 | $36,190 | $129,514 |
| 2017 | $943 | $149,333 | $32,900 | $116,433 |
| 2016 | $845 | $129,907 | $32,900 | $97,007 |
| 2015 | $796 | $124,442 | $32,900 | $91,542 |
| 2014 | $796 | $121,725 | $35,444 | $86,281 |
| 2013 | -- | $66,949 | $0 | $0 |
Source: Public Records
Map
Nearby Homes