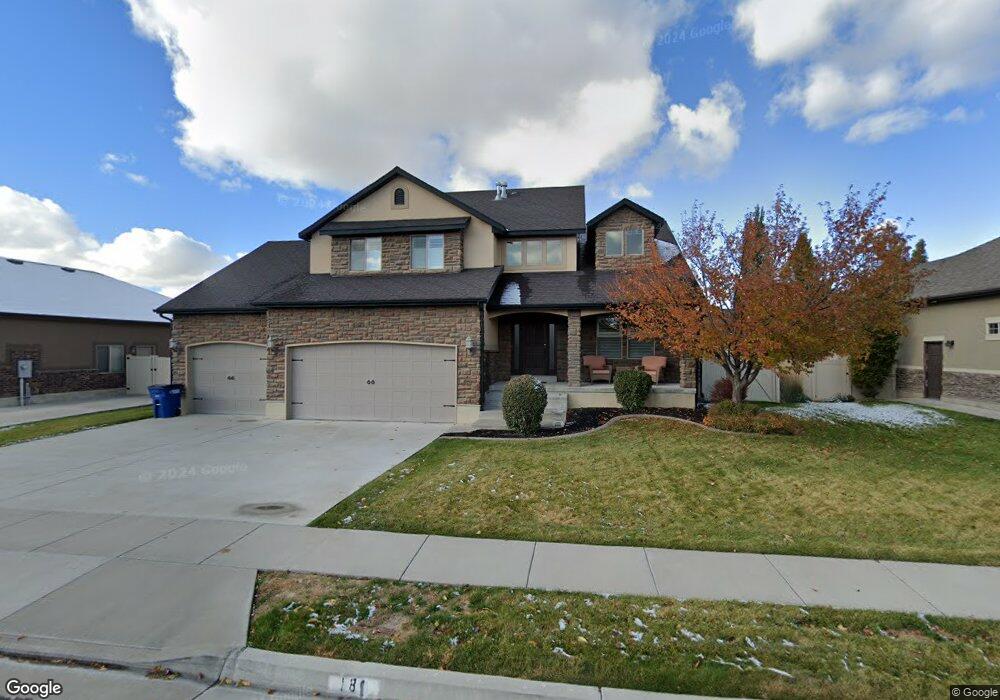
181 N 3600 W Layton, UT 84041
Estimated Value: $685,000 - $747,496
3
Beds
3
Baths
4,307
Sq Ft
$169/Sq Ft
Est. Value
About This Home
This home is located at 181 N 3600 W, Layton, UT 84041 and is currently estimated at $727,624, approximately $168 per square foot. 181 N 3600 W is a home located in Davis County with nearby schools including Sand Springs Elementary School, Legacy Junior High School, and Layton High School.
Ownership History
Date
Name
Owned For
Owner Type
Purchase Details
Closed on
May 27, 2025
Sold by
Jones Paul R and Jones Sarah
Bought by
Paul And Sarah Jones Living Trust and Jones
Current Estimated Value
Purchase Details
Closed on
Nov 7, 2012
Sold by
Vison Kelton and Vison Jennifer
Bought by
Jones Paul R and Jones Sarah
Home Financials for this Owner
Home Financials are based on the most recent Mortgage that was taken out on this home.
Original Mortgage
$205,000
Interest Rate
2.71%
Mortgage Type
New Conventional
Purchase Details
Closed on
Apr 16, 2009
Sold by
Pittman Daniel W and Pittman Kellen A
Bought by
Vinson Kelton and Vinson Jennifer
Home Financials for this Owner
Home Financials are based on the most recent Mortgage that was taken out on this home.
Original Mortgage
$292,916
Interest Rate
5.17%
Mortgage Type
FHA
Purchase Details
Closed on
Jul 18, 2007
Sold by
Terraventure Development Ltd
Bought by
Pittman Daniel W and Pittman Kellen A
Home Financials for this Owner
Home Financials are based on the most recent Mortgage that was taken out on this home.
Original Mortgage
$296,000
Interest Rate
6.73%
Mortgage Type
Construction
Create a Home Valuation Report for This Property
The Home Valuation Report is an in-depth analysis detailing your home's value as well as a comparison with similar homes in the area
Home Values in the Area
Average Home Value in this Area
Purchase History
| Date | Buyer | Sale Price | Title Company |
|---|---|---|---|
| Paul And Sarah Jones Living Trust | -- | None Listed On Document | |
| Jones Paul R | -- | None Available | |
| Vinson Kelton | -- | Mountain View Title | |
| Pittman Daniel W | -- | Backman Title Services |
Source: Public Records
Mortgage History
| Date | Status | Borrower | Loan Amount |
|---|---|---|---|
| Previous Owner | Jones Paul R | $205,000 | |
| Previous Owner | Vinson Kelton | $292,916 | |
| Previous Owner | Pittman Daniel W | $296,000 |
Source: Public Records
Tax History Compared to Growth
Tax History
| Year | Tax Paid | Tax Assessment Tax Assessment Total Assessment is a certain percentage of the fair market value that is determined by local assessors to be the total taxable value of land and additions on the property. | Land | Improvement |
|---|---|---|---|---|
| 2025 | $3,752 | $393,800 | $119,150 | $274,650 |
| 2024 | $3,563 | $376,750 | $130,041 | $246,709 |
| 2023 | $3,477 | $648,000 | $132,225 | $515,775 |
| 2022 | $3,684 | $372,900 | $80,300 | $292,600 |
| 2021 | $3,379 | $510,000 | $120,458 | $389,542 |
| 2020 | $3,059 | $443,000 | $101,969 | $341,031 |
| 2019 | $2,968 | $421,000 | $103,173 | $317,827 |
| 2018 | $2,760 | $393,000 | $90,651 | $302,349 |
| 2016 | $2,709 | $198,990 | $36,354 | $162,636 |
| 2015 | $2,379 | $165,880 | $36,354 | $129,526 |
| 2014 | $2,198 | $156,733 | $36,354 | $120,379 |
| 2013 | -- | $157,767 | $38,823 | $118,944 |
Source: Public Records
Map
Nearby Homes
- 567 W 3575 S
- 454 N 3550 W
- 101 S 3600 W
- 3169 S 550 W
- 3583 W 200 S
- 3535 W Overlook Dr
- 245 S Summer Breeze Ln
- 697 N 3275 W
- 967 W Yamada Ct
- 3263 W 850 N
- 803 W 2800 S
- 1139 W 3150 S
- 3528 S Finch St
- 2794 W Gentile St
- 3067 S Old Emigrant Rd Unit B
- 2784 S 1720 W Unit F
- 3637 S Creek Side Ln
- 3391 W 1125 N
- 2674 S 75 E
- 475 W 2400 S