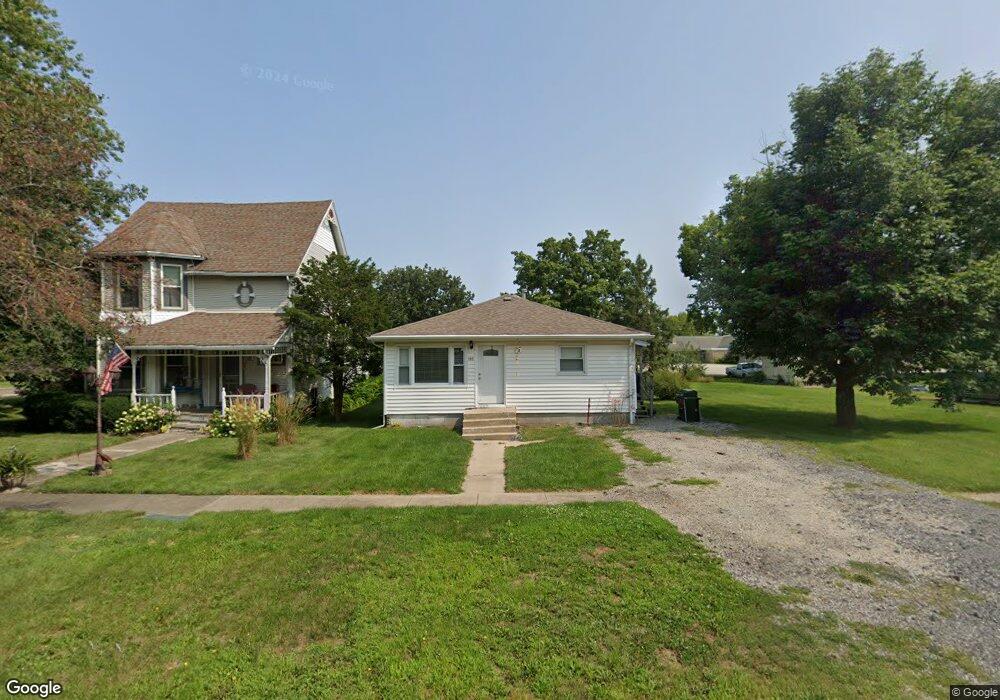
181 Orchard St Chebanse, IL 60922
Estimated Value: $133,000 - $192,000
2
Beds
1
Bath
1,048
Sq Ft
$151/Sq Ft
Est. Value
About This Home
This home is located at 181 Orchard St, Chebanse, IL 60922 and is currently estimated at $158,504, approximately $151 per square foot. 181 Orchard St is a home located in Kankakee County with nearby schools including Chebanse Elementary School, John L. Nash Middle School, and Central High School.
Ownership History
Date
Name
Owned For
Owner Type
Purchase Details
Closed on
Jul 22, 2022
Sold by
M & W Holdings Of Bourbonnais Llc
Bought by
Mr Rentals Of Kankakee Llc
Current Estimated Value
Home Financials for this Owner
Home Financials are based on the most recent Mortgage that was taken out on this home.
Original Mortgage
$2,000,000
Outstanding Balance
$801,387
Interest Rate
5.81%
Mortgage Type
New Conventional
Estimated Equity
-$642,883
Purchase Details
Closed on
Mar 3, 2021
Sold by
Trust Number 2532
Bought by
M & W Holdings Of Bourbonnais Ll
Purchase Details
Closed on
Jan 31, 2019
Sold by
Trust Number 2672
Bought by
Trust Number 2532
Purchase Details
Closed on
Nov 13, 2017
Sold by
Federal Home Loan Mortgage Corporation
Bought by
Municipal Trust
Create a Home Valuation Report for This Property
The Home Valuation Report is an in-depth analysis detailing your home's value as well as a comparison with similar homes in the area
Home Values in the Area
Average Home Value in this Area
Purchase History
| Date | Buyer | Sale Price | Title Company |
|---|---|---|---|
| Mr Rentals Of Kankakee Llc | -- | Homestar Title | |
| M & W Holdings Of Bourbonnais Ll | -- | Barmann Bohlen & Scott Pc | |
| Trust Number 2532 | -- | -- | |
| Municipal Trust | $32,500 | Codilis & Associates Pc |
Source: Public Records
Mortgage History
| Date | Status | Borrower | Loan Amount |
|---|---|---|---|
| Open | Mr Rentals Of Kankakee Llc | $2,000,000 |
Source: Public Records
Tax History Compared to Growth
Tax History
| Year | Tax Paid | Tax Assessment Tax Assessment Total Assessment is a certain percentage of the fair market value that is determined by local assessors to be the total taxable value of land and additions on the property. | Land | Improvement |
|---|---|---|---|---|
| 2024 | $3,663 | $45,846 | $8,056 | $37,790 |
| 2023 | $3,465 | $41,584 | $7,307 | $34,277 |
| 2022 | $3,245 | $39,138 | $6,877 | $32,261 |
| 2021 | $3,196 | $36,663 | $6,442 | $30,221 |
| 2020 | $3,038 | $34,506 | $6,063 | $28,443 |
| 2019 | $2,896 | $32,400 | $5,693 | $26,707 |
| 2018 | $2,842 | $31,921 | $5,609 | $26,312 |
| 2017 | $2,299 | $31,219 | $5,486 | $25,733 |
| 2016 | $2,112 | $30,091 | $5,288 | $24,803 |
| 2015 | $2,023 | $28,795 | $5,060 | $23,735 |
| 2014 | $1,982 | $27,957 | $4,913 | $23,044 |
| 2013 | -- | $28,454 | $5,000 | $23,454 |
Source: Public Records
Map
Nearby Homes
- 360 W 2nd St S
- 0 E 3400 Rd N Unit NOC6330916
- 0 E 3400 Rd N Unit NOC6330915
- 0 Hwy 45 at E 3400 Rd N Unit NOC6330917
- 6563 S Route 45 52
- 2060 W 5000s Rd
- 3110 N Old Us Highway 45
- Lake View Drive Lot Unit WP001
- 0 Lake View Dr Unit MRD12455038
- 420 N Fourth St
- 395 E 1st Ave
- 195 E 2nd Ave
- 195 W 3rd Ave
- 175 E 3rd Ave
- 1258 E 2900 Rd N
- 050 E 2800 Rd N
- 235 Hanson Dr
- 475 Riverstone Pkwy
- 1627 W 2000s Rd
- 4112 S Youth Camp Rd