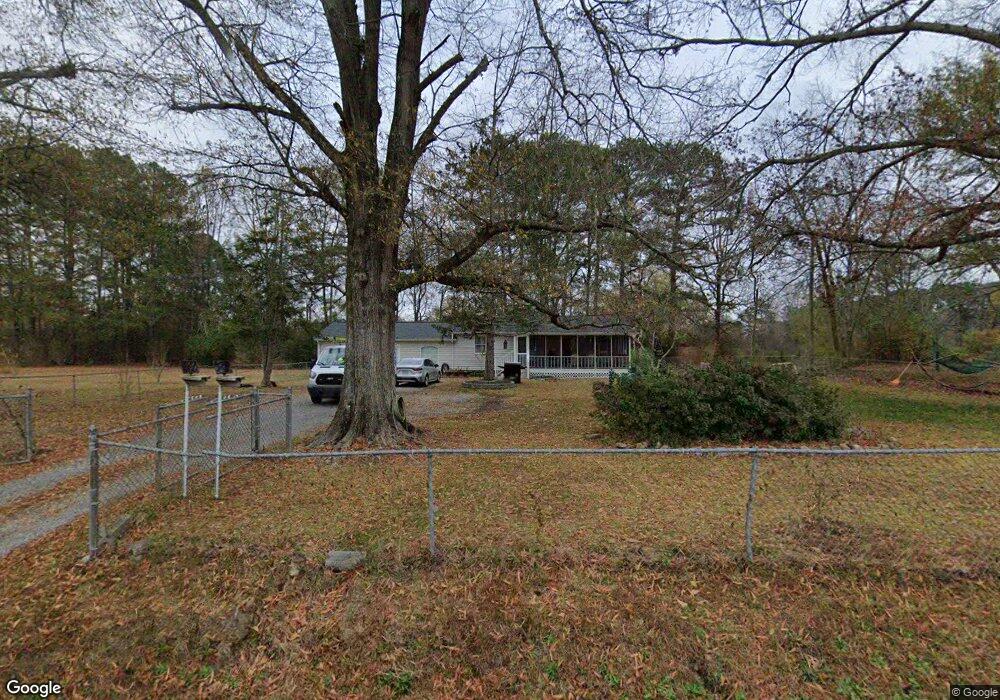
181 Putman Rd Resaca, GA 30735
Estimated Value: $196,000 - $238,000
3
Beds
2
Baths
1,274
Sq Ft
$166/Sq Ft
Est. Value
About This Home
This home is located at 181 Putman Rd, Resaca, GA 30735 and is currently estimated at $211,486, approximately $166 per square foot. 181 Putman Rd is a home located in Whitfield County with nearby schools including Valley Point Elementary School, Valley Point Middle School, and Southeast Whitfield County High School.
Ownership History
Date
Name
Owned For
Owner Type
Purchase Details
Closed on
Aug 5, 2021
Sold by
Nunez Israel
Bought by
Nunez Natalie
Current Estimated Value
Home Financials for this Owner
Home Financials are based on the most recent Mortgage that was taken out on this home.
Original Mortgage
$127,645
Outstanding Balance
$116,069
Interest Rate
2.9%
Mortgage Type
FHA
Estimated Equity
$95,417
Purchase Details
Closed on
May 12, 2017
Sold by
Martin Wanda G
Bought by
Nunez Israel and Herrera Elena A
Home Financials for this Owner
Home Financials are based on the most recent Mortgage that was taken out on this home.
Original Mortgage
$88,369
Interest Rate
4.25%
Mortgage Type
FHA
Purchase Details
Closed on
Oct 31, 2002
Sold by
Maddox James Wesley and Maddox Tonda
Bought by
Martin Wanda G
Purchase Details
Closed on
Nov 1, 1996
Bought by
Maddox James Wesley and Maddox Tonda
Create a Home Valuation Report for This Property
The Home Valuation Report is an in-depth analysis detailing your home's value as well as a comparison with similar homes in the area
Home Values in the Area
Average Home Value in this Area
Purchase History
| Date | Buyer | Sale Price | Title Company |
|---|---|---|---|
| Nunez Natalie | $130,000 | -- | |
| Nunez Israel | $90,000 | -- | |
| Martin Wanda G | $80,000 | -- | |
| Maddox James Wesley | $55,800 | -- |
Source: Public Records
Mortgage History
| Date | Status | Borrower | Loan Amount |
|---|---|---|---|
| Open | Nunez Natalie | $127,645 | |
| Previous Owner | Nunez Israel | $88,369 |
Source: Public Records
Tax History Compared to Growth
Tax History
| Year | Tax Paid | Tax Assessment Tax Assessment Total Assessment is a certain percentage of the fair market value that is determined by local assessors to be the total taxable value of land and additions on the property. | Land | Improvement |
|---|---|---|---|---|
| 2024 | $1,581 | $78,947 | $4,485 | $74,462 |
| 2023 | $1,581 | $37,606 | $2,376 | $35,230 |
| 2022 | $879 | $29,786 | $1,939 | $27,847 |
| 2021 | $626 | $29,786 | $1,939 | $27,847 |
| 2020 | $636 | $29,786 | $1,939 | $27,847 |
| 2019 | $641 | $29,786 | $1,939 | $27,847 |
| 2018 | $646 | $29,784 | $1,937 | $27,847 |
| 2017 | $646 | $29,784 | $1,937 | $27,847 |
| 2016 | $545 | $26,855 | $1,490 | $25,365 |
| 2014 | $562 | $28,272 | $2,907 | $25,365 |
| 2013 | -- | $28,271 | $2,906 | $25,364 |
Source: Public Records
Map
Nearby Homes
- 4381 S Dixie Hwy
- 73 Acres S Dixie Hwy
- 323 Tubman Way
- 402 W Nance Springs Rd
- 3737 S Dixie Rd
- 0 Carbondale Rd SW Unit 129966
- 0 Carbondale Rd SW Unit 7574085
- 0 Carbondale Rd SW Unit 130445
- 0 Carbondale Rd SW Unit 1522370
- 0 Carbondale Rd SW Unit 10515867
- 0 Carbondale Rd SW Unit 129726
- 4280 Old Dixie Hwy SE
- 213 Gwendolyn Lee Ln
- 4888 Cline Rd
- 122 Robin Hood Dr
- 116 Robin Hood Dr
- 112 Robin Hood Dr
- 104 W Nance Springs Rd
- 137 Praters Dr
- 0 Old Dixie Hwy
- 181 Ben Putnam Rd
- 187 Ben Putnam Rd
- 173 Ben Putnam Rd
- 165 Ben Putnam Rd
- 195 Ben Putnam Rd
- 200 Ben Putnam Rd
- 129 Ben Putnam Rd
- 160 Ben Putnam Rd
- 139 Ben Putnam Rd
- 212 Ben Putnam Rd
- 272 Telford Way
- 222 Ben Putnam Rd
- 136 Ben Putnam Rd
- 121 Ben Putnam Rd
- 120 Ben Putnam Rd
- 4486 S Dixie Hwy
- 4476 S Dixie Hwy
- 239 Ben Putnam Rd
- 112 Ben Putnam Rd
- 150 Ben Putnam Rd