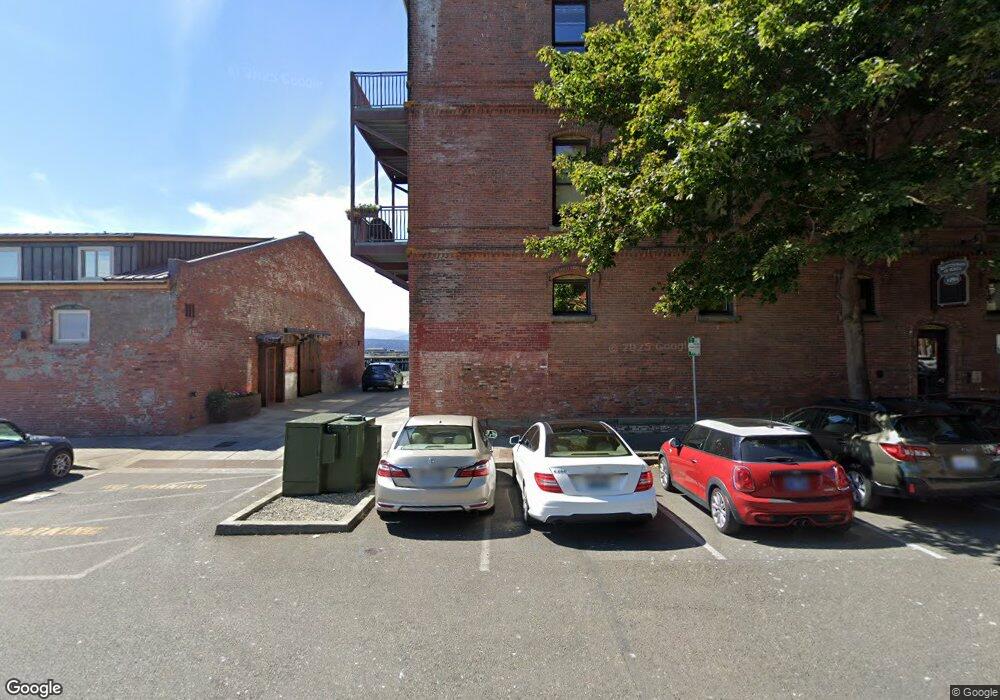
181 Quincy St Port Townsend, WA 98368
Estimated Value: $477,000 - $567,000
--
Bed
--
Bath
730
Sq Ft
$719/Sq Ft
Est. Value
About This Home
This home is located at 181 Quincy St, Port Townsend, WA 98368 and is currently estimated at $524,633, approximately $718 per square foot. 181 Quincy St is a home located in Jefferson County with nearby schools including Salish Coast Elementary School, Blue Heron Middle School, and Port Townsend High School.
Ownership History
Date
Name
Owned For
Owner Type
Purchase Details
Closed on
Oct 7, 2022
Sold by
Rabeler Carl Raymond
Bought by
Laura L Cooksey Trust
Current Estimated Value
Purchase Details
Closed on
Dec 3, 2021
Sold by
Appleton William
Bought by
Rabeler Carl Raymond and Rabeler Carl Raymond
Purchase Details
Closed on
Jun 13, 2019
Sold by
Little David A and The Duane A Little Revocable T
Bought by
Appleton William
Purchase Details
Closed on
Jul 14, 2014
Sold by
Little Ann L
Bought by
Duane A Little Revocable Trust and Little David A
Purchase Details
Closed on
Nov 20, 2006
Sold by
Ballenas Inc
Bought by
Little Duane A and Little Ann L
Home Financials for this Owner
Home Financials are based on the most recent Mortgage that was taken out on this home.
Original Mortgage
$285,000
Interest Rate
6.36%
Mortgage Type
Purchase Money Mortgage
Create a Home Valuation Report for This Property
The Home Valuation Report is an in-depth analysis detailing your home's value as well as a comparison with similar homes in the area
Home Values in the Area
Average Home Value in this Area
Purchase History
| Date | Buyer | Sale Price | Title Company |
|---|---|---|---|
| Laura L Cooksey Trust | -- | -- | |
| Rabeler Carl Raymond | $455,000 | First Amer Ttl Of Jefferson | |
| Appleton William | $347,000 | Frontier Title & Escrow Co | |
| Duane A Little Revocable Trust | -- | Jefferson Title Co Inc | |
| Little Duane A | $285,000 | Jefferson Title Company |
Source: Public Records
Mortgage History
| Date | Status | Borrower | Loan Amount |
|---|---|---|---|
| Previous Owner | Little Duane A | $285,000 |
Source: Public Records
Tax History Compared to Growth
Tax History
| Year | Tax Paid | Tax Assessment Tax Assessment Total Assessment is a certain percentage of the fair market value that is determined by local assessors to be the total taxable value of land and additions on the property. | Land | Improvement |
|---|---|---|---|---|
| 2024 | $4,085 | $495,280 | $250,000 | $245,280 |
| 2023 | $4,085 | $454,840 | $230,000 | $224,840 |
| 2022 | $3,119 | $413,770 | $195,500 | $218,270 |
| 2021 | $2,849 | $321,214 | $172,805 | $148,409 |
| 2020 | $2,923 | $282,962 | $154,080 | $128,882 |
| 2019 | $2,514 | $282,962 | $154,080 | $128,882 |
| 2018 | $2,379 | $264,450 | $144,000 | $120,450 |
| 2017 | $2,227 | $218,725 | $100,100 | $118,625 |
| 2016 | $1,977 | $218,725 | $100,100 | $118,625 |
| 2015 | -- | $201,900 | $92,400 | $109,500 |
| 2014 | -- | $168,250 | $77,000 | $91,250 |
| 2013 | -- | $168,250 | $77,000 | $91,250 |
Source: Public Records
Map
Nearby Homes
- 702 Water St Unit 1-3
- 842 Washington St Unit 203
- 842 Washington St Unit 204
- 533 Quincy St
- 538 Adams St
- 537 Jackson St
- 7 XXX Water St
- 800 Polk St Unit 204C
- 509 Garfield St
- 410 Lincoln St
- 1127 Adams St
- 1055 Monroe St
- 1738 Washington St
- 301 E St
- 1602 Lincoln St
- 1815 Lawrence St
- 2021 Clay St
- 1707 Jackson St
- 999 Reed St
- 9999 Maple Parcel A & B St
- 181 Quincy St Unit 203
- 181 Quincy St Unit 204
- 181 Quincy St Unit 1 02
- 181 Quincy St
- 181 Quincy St
- 181 Quincy St
- 181 Quincy St
- 181 Quincy St
- 181 Quincy St
- 181 Quincy St
- 181 Quincy St
- 181 Quincy St
- 181 Quincy St Unit 101
- 181 Quincy St Unit 303
- 181 Quincy St Unit 304
- 181 Quincy St Unit 301
- 181 Quincy St Unit 201
- 181 Quincy St Unit 302
- 181 01and02 Qiuncy St Unit 1 02
- 181 #01 Qiuncy St Unit 1