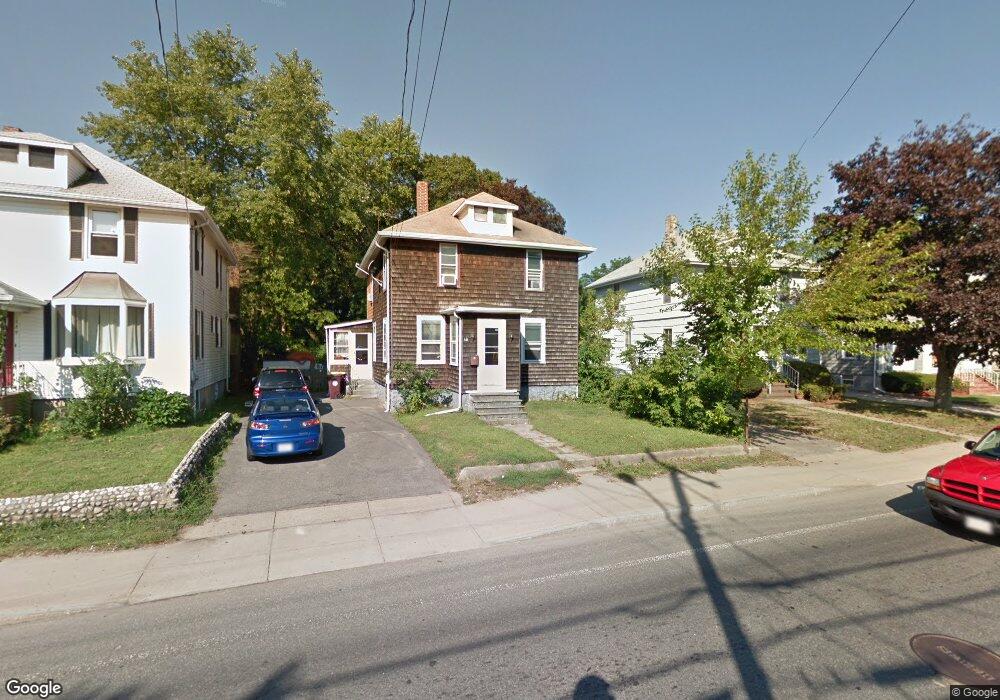
181 S Main St Acushnet, MA 02743
Estimated Value: $352,000 - $432,000
3
Beds
1
Bath
1,560
Sq Ft
$258/Sq Ft
Est. Value
About This Home
This home is located at 181 S Main St, Acushnet, MA 02743 and is currently estimated at $403,152, approximately $258 per square foot. 181 S Main St is a home located in Bristol County with nearby schools including Acushnet Elementary School, Albert F Ford Middle School, and Alma Del Mar Charter School.
Ownership History
Date
Name
Owned For
Owner Type
Purchase Details
Closed on
Mar 30, 1998
Sold by
Gonneville Raymond H and Carr Constance J
Bought by
Docouto Robert P and Docouto Patricia A
Current Estimated Value
Home Financials for this Owner
Home Financials are based on the most recent Mortgage that was taken out on this home.
Original Mortgage
$81,500
Interest Rate
6.96%
Mortgage Type
Purchase Money Mortgage
Create a Home Valuation Report for This Property
The Home Valuation Report is an in-depth analysis detailing your home's value as well as a comparison with similar homes in the area
Home Values in the Area
Average Home Value in this Area
Purchase History
| Date | Buyer | Sale Price | Title Company |
|---|---|---|---|
| Docouto Robert P | $86,000 | -- |
Source: Public Records
Mortgage History
| Date | Status | Borrower | Loan Amount |
|---|---|---|---|
| Open | Docouto Robert P | $90,000 | |
| Closed | Docouto Robert P | $100,000 | |
| Closed | Docouto Robert P | $81,500 |
Source: Public Records
Tax History
| Year | Tax Paid | Tax Assessment Tax Assessment Total Assessment is a certain percentage of the fair market value that is determined by local assessors to be the total taxable value of land and additions on the property. | Land | Improvement |
|---|---|---|---|---|
| 2025 | $33 | $302,100 | $95,000 | $207,100 |
| 2024 | $3,122 | $273,600 | $90,600 | $183,000 |
| 2023 | $3,070 | $255,800 | $81,800 | $174,000 |
| 2022 | $2,868 | $216,100 | $77,400 | $138,700 |
| 2021 | $2,830 | $204,600 | $77,400 | $127,200 |
| 2020 | $2,852 | $204,600 | $77,400 | $127,200 |
| 2019 | $2,674 | $188,600 | $68,500 | $120,100 |
| 2018 | $1,815 | $179,200 | $68,500 | $110,700 |
| 2017 | $2,495 | $172,800 | $68,500 | $104,300 |
| 2016 | $2,341 | $161,100 | $68,500 | $92,600 |
| 2015 | $2,301 | $161,100 | $68,500 | $92,600 |
Source: Public Records
Map
Nearby Homes
- 12 Hayes St Unit 1
- 14 Hayes St Unit 1
- 11 Boylston St
- 12 White St
- 122 Truro St
- 91 S Main St
- 0 Hathaway Rd Unit 73469544
- 81 Sylvia St
- 53 Howard Ave
- 23 Oliveira Ave
- 112 Lawson Ave
- 34 Chicopee St
- 41 Chershire Ave
- 14 Caswell St
- 20 Jake Ln
- 4 Sam St
- 1940-1942 Acushnet Ave
- 99 Hatch St
- 25 Pershing Ave
- 5 William St
Your Personal Tour Guide
Ask me questions while you tour the home.