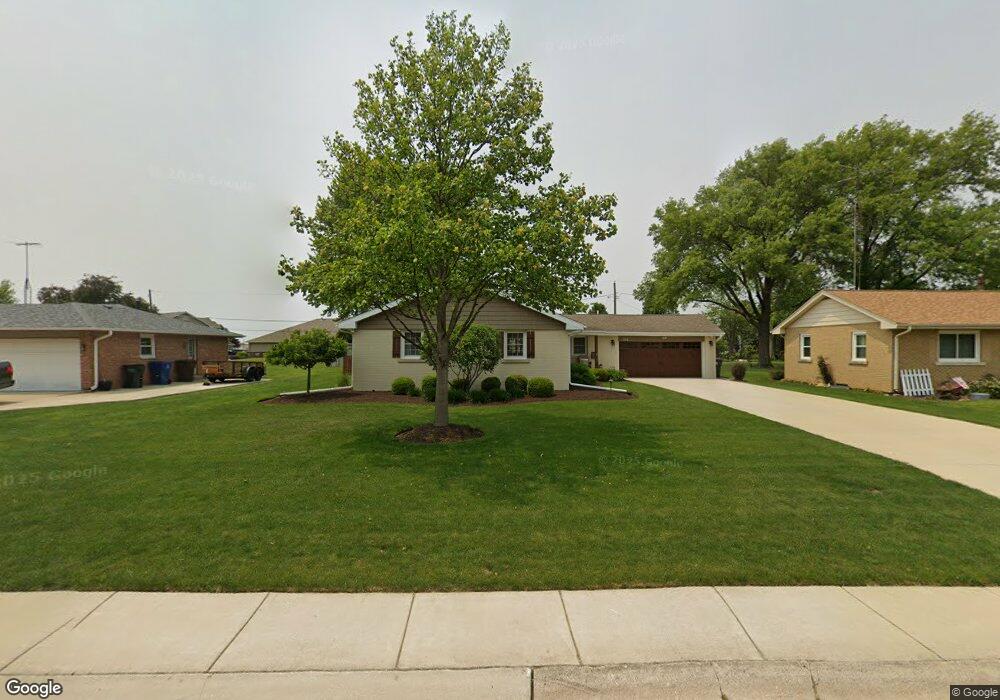
181 S Poplar St Manteno, IL 60950
Estimated Value: $221,000 - $282,103
5
Beds
2
Baths
1,408
Sq Ft
$185/Sq Ft
Est. Value
About This Home
This home is located at 181 S Poplar St, Manteno, IL 60950 and is currently estimated at $260,526, approximately $185 per square foot. 181 S Poplar St is a home located in Kankakee County with nearby schools including Manteno Elementary School, Manteno Middle School, and Manteno High School.
Ownership History
Date
Name
Owned For
Owner Type
Purchase Details
Closed on
Jan 5, 2024
Sold by
Marion Sarah L
Bought by
Marion Ryan E
Current Estimated Value
Home Financials for this Owner
Home Financials are based on the most recent Mortgage that was taken out on this home.
Original Mortgage
$204,000
Outstanding Balance
$200,028
Interest Rate
6.38%
Mortgage Type
New Conventional
Estimated Equity
$60,498
Purchase Details
Closed on
Feb 24, 2020
Sold by
Marion Ryan E and Marion Sarah L
Bought by
Marion Ryan E and Marion Sarah L
Home Financials for this Owner
Home Financials are based on the most recent Mortgage that was taken out on this home.
Original Mortgage
$143,747
Interest Rate
3.5%
Mortgage Type
New Conventional
Purchase Details
Closed on
May 13, 2015
Sold by
Mausehund A H & J M Trust
Bought by
Marion Sarah L and Ryan Marion E
Create a Home Valuation Report for This Property
The Home Valuation Report is an in-depth analysis detailing your home's value as well as a comparison with similar homes in the area
Home Values in the Area
Average Home Value in this Area
Purchase History
| Date | Buyer | Sale Price | Title Company |
|---|---|---|---|
| Marion Ryan E | -- | None Listed On Document | |
| Marion Ryan E | -- | Kankakee County Title | |
| Marion Sarah L | $150,100 | Kankakee Cnty Title & Tr |
Source: Public Records
Mortgage History
| Date | Status | Borrower | Loan Amount |
|---|---|---|---|
| Open | Marion Ryan E | $204,000 | |
| Previous Owner | Marion Ryan E | $143,747 |
Source: Public Records
Tax History Compared to Growth
Tax History
| Year | Tax Paid | Tax Assessment Tax Assessment Total Assessment is a certain percentage of the fair market value that is determined by local assessors to be the total taxable value of land and additions on the property. | Land | Improvement |
|---|---|---|---|---|
| 2024 | $6,957 | $81,774 | $12,239 | $69,535 |
| 2023 | $6,754 | $75,090 | $11,228 | $63,862 |
| 2022 | $6,243 | $66,281 | $10,138 | $56,143 |
| 2021 | $6,120 | $64,377 | $10,138 | $54,239 |
| 2020 | $5,999 | $61,548 | $9,867 | $51,681 |
| 2019 | $5,969 | $60,894 | $9,769 | $51,125 |
| 2018 | $5,629 | $58,837 | $9,625 | $49,212 |
| 2017 | $5,729 | $60,006 | $9,530 | $50,476 |
| 2016 | $5,512 | $60,048 | $9,530 | $50,518 |
| 2015 | $5,412 | $57,743 | $9,343 | $48,400 |
| 2014 | $5,178 | $53,877 | $9,205 | $44,672 |
| 2013 | -- | $54,421 | $9,298 | $45,123 |
Source: Public Records
Map
Nearby Homes
- 236 Marquette Place S
- 23 N Maple St
- 22 N Maple St Unit MR22
- 398 S Elm St
- 284 W Second St
- 386 Park St
- 296 S Oak St
- 445 Stonegate Way
- 0 N Cypress Dr
- 264 W Third St
- 376 S Oak St
- 450 S Walnut St
- 285 W Third St
- 7500 Illinois 50
- 101 E Division St Unit 101
- Lot 16 Southcreek Dr
- 6 Phelps Ct
- 631 Holtz St
- 624 Brian Dr
- 510 Willow Rd
- 171 S Poplar St
- 201 S Poplar St
- 151 S Poplar St
- 213 S Poplar St
- 264 Marquette Place S
- 243 S Poplar St
- 266 Marquette Place S
- 226 Marquette Place S
- 180 S Poplar St
- 160 S Poplar St
- 202 S Poplar St
- 225 S Poplar St
- 131 S Poplar St
- 272 Marquette Place S
- 224 Marquette Place S
- 250 Marquette Place S
- 140 S Poplar St
- 238 Marquette Place S
- 274 Marquette Place S