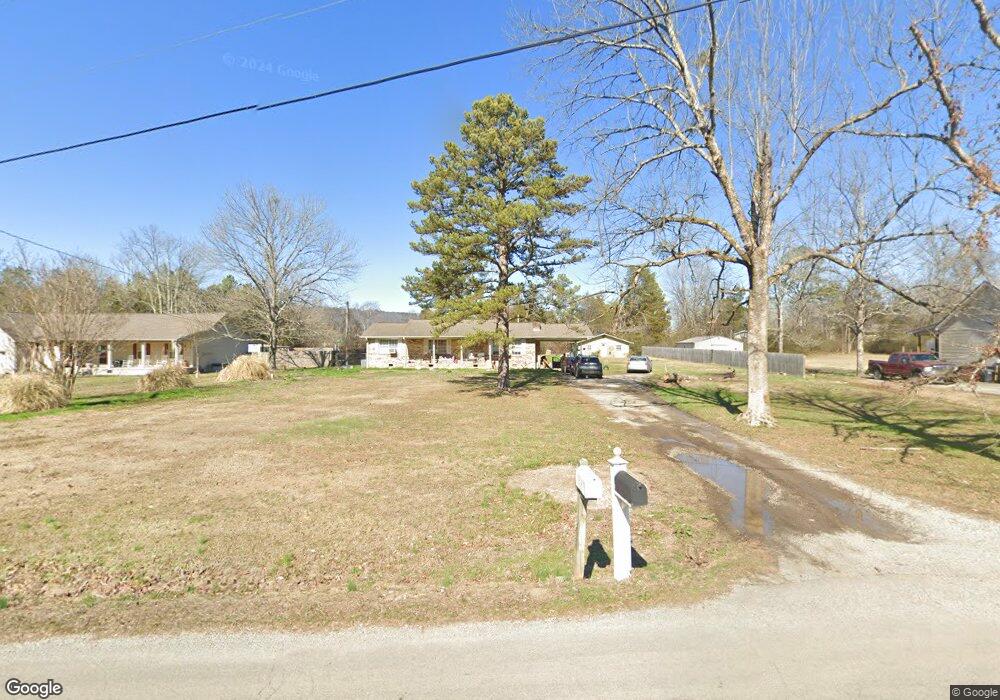
181 Sells Ln Trenton, GA 30752
Estimated Value: $259,769 - $278,000
4
Beds
2
Baths
1,726
Sq Ft
$155/Sq Ft
Est. Value
About This Home
This home is located at 181 Sells Ln, Trenton, GA 30752 and is currently estimated at $267,942, approximately $155 per square foot. 181 Sells Ln is a home located in Dade County with nearby schools including Dade Middle School and Dade County High School.
Ownership History
Date
Name
Owned For
Owner Type
Purchase Details
Closed on
May 6, 2010
Sold by
Windsock Properties Llc
Bought by
Curington Nathaniel L
Current Estimated Value
Home Financials for this Owner
Home Financials are based on the most recent Mortgage that was taken out on this home.
Original Mortgage
$137,754
Outstanding Balance
$92,782
Interest Rate
5.15%
Mortgage Type
New Conventional
Estimated Equity
$175,160
Purchase Details
Closed on
Jun 2, 2009
Sold by
Griggs Michelle A
Bought by
Windsock Properties
Purchase Details
Closed on
Mar 13, 2008
Sold by
Ross John W Michelle A
Bought by
Griggs Michelle A
Purchase Details
Closed on
Oct 19, 2005
Sold by
Jahn Richard P
Bought by
Ross John W and Ross Michelle A
Home Financials for this Owner
Home Financials are based on the most recent Mortgage that was taken out on this home.
Original Mortgage
$96,000
Interest Rate
5.76%
Mortgage Type
New Conventional
Purchase Details
Closed on
Jun 7, 1999
Sold by
Short John and Short Marion
Bought by
Short Gwendolyn
Create a Home Valuation Report for This Property
The Home Valuation Report is an in-depth analysis detailing your home's value as well as a comparison with similar homes in the area
Home Values in the Area
Average Home Value in this Area
Purchase History
| Date | Buyer | Sale Price | Title Company |
|---|---|---|---|
| Curington Nathaniel L | $135,000 | -- | |
| Curington Nathaniel L | $135,000 | -- | |
| Curington Nathaniel L | $135,000 | -- | |
| Windsock Properties | $54,990 | -- | |
| Windsock Properties | $54,990 | -- | |
| Griggs Michelle A | -- | -- | |
| Ross John W | $120,000 | -- | |
| Short Gwendolyn | $66,500 | -- |
Source: Public Records
Mortgage History
| Date | Status | Borrower | Loan Amount |
|---|---|---|---|
| Open | Curington Nathaniel L | $137,754 | |
| Previous Owner | Ross John W | $96,000 |
Source: Public Records
Tax History Compared to Growth
Tax History
| Year | Tax Paid | Tax Assessment Tax Assessment Total Assessment is a certain percentage of the fair market value that is determined by local assessors to be the total taxable value of land and additions on the property. | Land | Improvement |
|---|---|---|---|---|
| 2024 | $2,712 | $94,440 | $13,720 | $80,720 |
| 2023 | $2,015 | $80,200 | $5,880 | $74,320 |
| 2022 | $1,587 | $64,120 | $5,880 | $58,240 |
| 2021 | $1,249 | $49,720 | $5,880 | $43,840 |
| 2020 | $1,235 | $47,280 | $5,880 | $41,400 |
| 2019 | $1,052 | $40,040 | $5,880 | $34,160 |
| 2018 | $1,054 | $40,040 | $5,880 | $34,160 |
| 2017 | $1,054 | $40,040 | $5,880 | $34,160 |
| 2016 | $1,022 | $39,040 | $5,880 | $33,160 |
| 2015 | $994 | $39,040 | $5,880 | $33,160 |
| 2014 | -- | $47,000 | $7,640 | $39,360 |
| 2013 | -- | $48,960 | $7,640 | $41,320 |
Source: Public Records
Map
Nearby Homes
- 134 Melissa Dr
- 204 Melissa Dr
- 11080 U S 11
- 493 Bernice Dr
- 738 Sells Ln
- 102 Sunset Dr
- 0 Georgia 136
- 165 N Woods Ln
- 0 Northwoods Ln Unit 1521613
- 54 Whispering Pines Dr
- 329 Glenview Dr
- 553 Back Valley Rd
- 331 Glenview Dr
- 394 Glenview Dr
- 396 Glenview Dr
- 1150 Back Valley Rd
- 000 W Ga 136 Hwy
- 40 Case Cir
- 51 N Case Ave
- 272 Cloud Rd
- 155 Sells Ln
- 197 Sells Ln
- 117 Sells Ln
- 249 Sells Ln
- 84 Melissa Dr
- 83 Melissa Dr
- 107 Sells Ln
- 144 Melissa Dr
- 67 Mountain View Rd
- 137 Melissa Dr
- 192 Rosewood Dr
- 46 Melissa Dr
- 0 Melissa Dr Unit 1359253
- 0 Melissa Dr Unit 972386
- 0 Melissa Dr Unit 1359265
- 0 Melissa Dr Unit RTC2717480
- 0 Melissa Dr Unit RTC2717466
- 0 Melissa Dr Unit 972388
- 0 Melissa Dr Unit Lot 66 1822747
- 180 Rosewood Dr