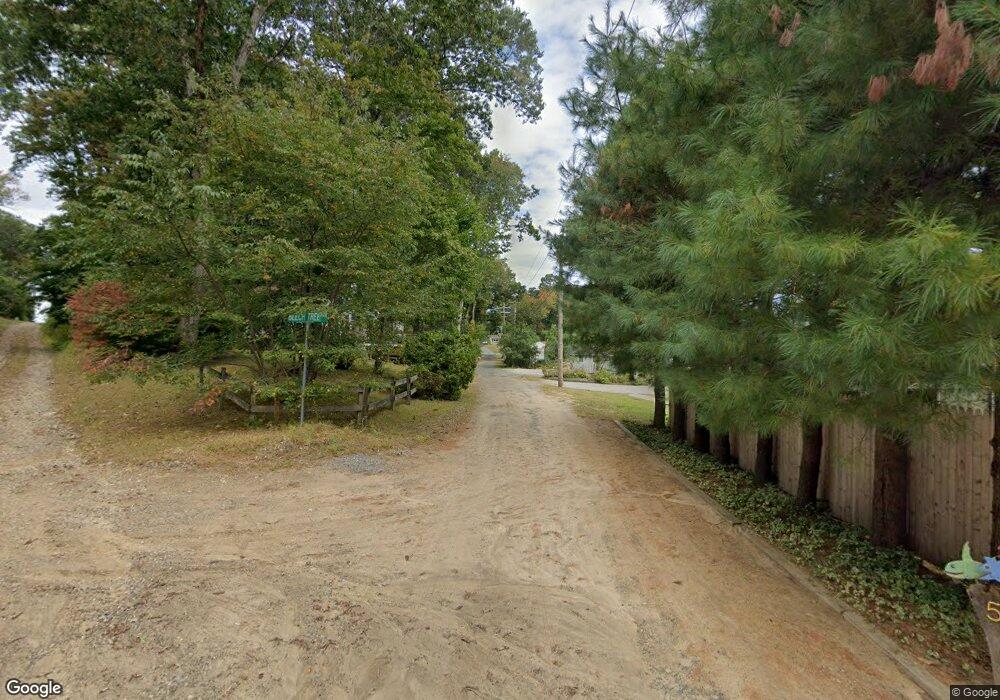
181 Shore Rd East Haddam, CT 06423
Estimated Value: $384,000 - $432,000
2
Beds
2
Baths
956
Sq Ft
$431/Sq Ft
Est. Value
About This Home
This home is located at 181 Shore Rd, East Haddam, CT 06423 and is currently estimated at $411,637, approximately $430 per square foot. 181 Shore Rd is a home located in Middlesex County with nearby schools including East Haddam Elementary School, Nathan Hale-Ray Middle School, and Nathan Hale-Ray High School.
Ownership History
Date
Name
Owned For
Owner Type
Purchase Details
Closed on
Jul 28, 2024
Sold by
Wilde Kathleen
Bought by
Baratt Robert
Current Estimated Value
Purchase Details
Closed on
Aug 27, 2013
Sold by
Wicks Donald L and Perry-Wicks Nancy
Bought by
Wilde Kathleen
Purchase Details
Closed on
Dec 27, 2011
Sold by
Wicks Donald and Wicks Nancy
Bought by
Wicks Donald and Wicks Nancy
Purchase Details
Closed on
May 18, 1995
Sold by
Sayre Craig and Sayre Cristina C
Bought by
Schweizer John N and Schweizer Marcella M
Purchase Details
Closed on
Nov 15, 1989
Sold by
Nastro Ticia
Bought by
Sayre Craig W
Home Financials for this Owner
Home Financials are based on the most recent Mortgage that was taken out on this home.
Original Mortgage
$0
Interest Rate
9.79%
Mortgage Type
Purchase Money Mortgage
Create a Home Valuation Report for This Property
The Home Valuation Report is an in-depth analysis detailing your home's value as well as a comparison with similar homes in the area
Home Values in the Area
Average Home Value in this Area
Purchase History
| Date | Buyer | Sale Price | Title Company |
|---|---|---|---|
| Baratt Robert | $430,000 | None Available | |
| Baratt Robert | $430,000 | None Available | |
| Wilde Kathleen | $310,000 | -- | |
| Wicks Donald | -- | -- | |
| Schweizer John N | $135,000 | -- | |
| Wilde Kathleen | $310,000 | -- | |
| Wicks Donald | -- | -- | |
| Schweizer John N | $135,000 | -- | |
| Sayre Craig W | $150,000 | -- |
Source: Public Records
Mortgage History
| Date | Status | Borrower | Loan Amount |
|---|---|---|---|
| Previous Owner | Sayre Craig W | $0 |
Source: Public Records
Tax History Compared to Growth
Tax History
| Year | Tax Paid | Tax Assessment Tax Assessment Total Assessment is a certain percentage of the fair market value that is determined by local assessors to be the total taxable value of land and additions on the property. | Land | Improvement |
|---|---|---|---|---|
| 2025 | $5,858 | $208,770 | $145,140 | $63,630 |
| 2024 | $5,587 | $208,770 | $145,140 | $63,630 |
| 2023 | $5,376 | $208,770 | $145,140 | $63,630 |
| 2022 | $4,372 | $137,520 | $98,600 | $38,920 |
| 2021 | $4,186 | $137,520 | $98,600 | $38,920 |
| 2020 | $4,186 | $137,520 | $98,600 | $38,920 |
| 2019 | $4,186 | $137,520 | $98,600 | $38,920 |
| 2018 | $4,079 | $137,520 | $98,600 | $38,920 |
| 2017 | $4,182 | $141,370 | $98,600 | $42,770 |
| 2016 | $4,149 | $141,370 | $98,600 | $42,770 |
| 2015 | $4,054 | $141,370 | $98,600 | $42,770 |
| 2014 | $3,945 | $141,400 | $98,630 | $42,770 |
Source: Public Records
Map
Nearby Homes