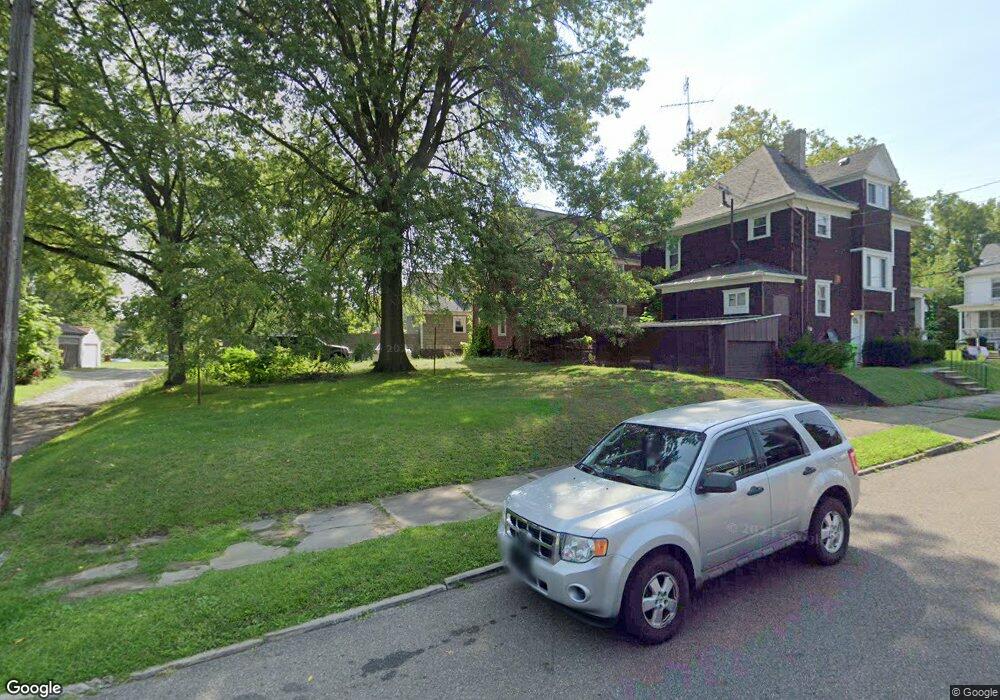
181 W Cambridge St Alliance, OH 44601
Estimated Value: $116,000 - $137,919
3
Beds
2
Baths
1,595
Sq Ft
$81/Sq Ft
Est. Value
About This Home
This home is located at 181 W Cambridge St, Alliance, OH 44601 and is currently estimated at $129,480, approximately $81 per square foot. 181 W Cambridge St is a home located in Stark County with nearby schools including Alliance Early Learning School, Alliance Intermediate School at Northside, and Alliance Middle School.
Ownership History
Date
Name
Owned For
Owner Type
Purchase Details
Closed on
Apr 13, 2011
Sold by
James Brandon R and James Danielle M
Bought by
James Brandon R
Current Estimated Value
Purchase Details
Closed on
Mar 17, 2006
Sold by
Felger Chris and Felger Lesa
Bought by
James Brandon R and Anderson Danielle M
Home Financials for this Owner
Home Financials are based on the most recent Mortgage that was taken out on this home.
Original Mortgage
$73,841
Outstanding Balance
$42,125
Interest Rate
6.33%
Mortgage Type
FHA
Estimated Equity
$87,355
Purchase Details
Closed on
Sep 30, 2004
Sold by
Ehrlinspiel Richard J and Ehrlispiel Virginia
Bought by
Felger Chris and Felger Lesa
Purchase Details
Closed on
Nov 18, 2002
Sold by
Estate Of Cecilia E Ehrlinspiel
Bought by
Ehrlinspiel Richard J and Ehrlinspiel James E
Create a Home Valuation Report for This Property
The Home Valuation Report is an in-depth analysis detailing your home's value as well as a comparison with similar homes in the area
Home Values in the Area
Average Home Value in this Area
Purchase History
| Date | Buyer | Sale Price | Title Company |
|---|---|---|---|
| James Brandon R | -- | None Available | |
| James Brandon R | $75,000 | None Available | |
| Felger Chris | $6,500 | Union Title Co | |
| Ehrlinspiel Richard J | -- | -- |
Source: Public Records
Mortgage History
| Date | Status | Borrower | Loan Amount |
|---|---|---|---|
| Open | James Brandon R | $73,841 |
Source: Public Records
Tax History Compared to Growth
Tax History
| Year | Tax Paid | Tax Assessment Tax Assessment Total Assessment is a certain percentage of the fair market value that is determined by local assessors to be the total taxable value of land and additions on the property. | Land | Improvement |
|---|---|---|---|---|
| 2025 | -- | $41,510 | $6,720 | $34,790 |
| 2024 | -- | $41,510 | $6,720 | $34,790 |
| 2023 | $1,014 | $25,240 | $6,270 | $18,970 |
| 2022 | $1,021 | $25,240 | $6,270 | $18,970 |
| 2021 | $1,022 | $25,240 | $6,270 | $18,970 |
| 2020 | $932 | $21,500 | $5,430 | $16,070 |
| 2019 | $919 | $21,570 | $5,430 | $16,140 |
| 2018 | $926 | $21,570 | $5,430 | $16,140 |
| 2017 | $828 | $18,970 | $4,410 | $14,560 |
| 2016 | $827 | $18,800 | $4,410 | $14,390 |
| 2015 | $835 | $18,800 | $4,410 | $14,390 |
| 2014 | $892 | $19,120 | $4,480 | $14,640 |
| 2013 | $445 | $19,120 | $4,480 | $14,640 |
Source: Public Records
Map
Nearby Homes
- 140 W Summit St
- 427 S Union Ave
- 132 S Haines Ave
- 645 W Summit St
- 807 S Union Ave
- 163 W Market St
- 345 W Market St
- 725 W Summit St
- 734 Parkway Blvd
- 329 1/2 W Main St
- 896 Parkway Blvd
- 432 S Linden Ave
- 356 E Broadway St
- 738 Kingsway St
- 452 E Summit St
- 361 E Main St
- 511 W Ely St
- V/L S Fredeom Ave
- 970 Kingsway St
- 1005 S Freedom Ave
- 189 W Cambridge St
- 177 W Cambridge St
- 193 W Cambridge St
- 171 W Cambridge St
- 520 S Haines Ave
- 182 W Oxford St
- 165 W Cambridge St
- 176 W Oxford St
- 205 W Cambridge St
- 186 W Cambridge St
- 172 W Cambridge St
- 184 W Oxford St
- 192 W Cambridge St
- 180 W Cambridge St
- 186 W Oxford St
- 174 W Cambridge St
- 157 W Cambridge St
- 170 W Cambridge St
- 209 W Cambridge St
- 521 S Haines Ave