Estimated Value: $200,000 - $246,000
--
Bed
4
Baths
1,918
Sq Ft
$116/Sq Ft
Est. Value
About This Home
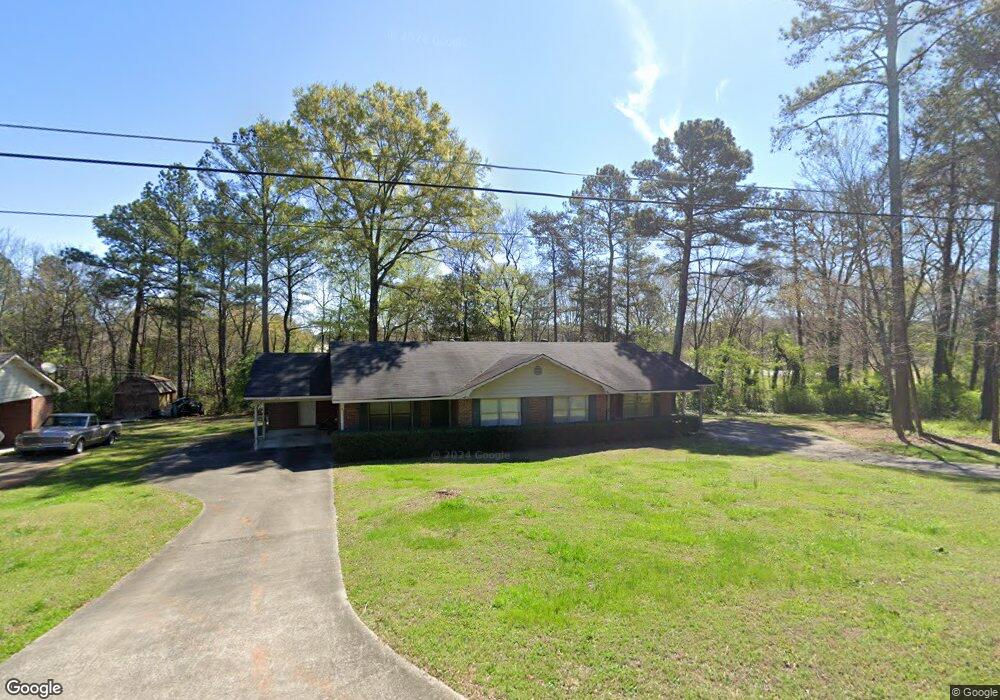
This home is located at 181 Welcome Hill Trail SW, Rome, GA 30161 and is currently estimated at $223,187, approximately $116 per square foot. 181 Welcome Hill Trail SW is a home located in Floyd County with nearby schools including Pepperell Middle School and Pepperell High School.
Ownership History
Date
Name
Owned For
Owner Type
Purchase Details
Closed on
Apr 19, 2016
Sold by
Ingram Ralph
Bought by
Pryor Richard L and Pryor Miranda C
Current Estimated Value
Home Financials for this Owner
Home Financials are based on the most recent Mortgage that was taken out on this home.
Original Mortgage
$75,000
Outstanding Balance
$31,861
Interest Rate
2.96%
Mortgage Type
New Conventional
Estimated Equity
$191,326
Purchase Details
Closed on
Oct 2, 2003
Sold by
Ingram Ralph
Bought by
Bramlette Rhonda and Ralph Ingram
Purchase Details
Closed on
Jan 1, 1986
Sold by
Cosbic Resources Inc
Bought by
Ingram Ralph
Purchase Details
Closed on
Dec 5, 1984
Sold by
Costley Realty & Development Co& Dr Jame
Bought by
Cosbic Resources Inc
Purchase Details
Closed on
Dec 1, 1984
Bought by
P and R
Purchase Details
Closed on
Feb 23, 1974
Bought by
Costley Realty & Development Co& Dr Jame
Create a Home Valuation Report for This Property
The Home Valuation Report is an in-depth analysis detailing your home's value as well as a comparison with similar homes in the area
Home Values in the Area
Average Home Value in this Area
Purchase History
| Date | Buyer | Sale Price | Title Company |
|---|---|---|---|
| Pryor Richard L | $100,000 | -- | |
| Bramlette Rhonda | -- | -- | |
| Ingram Ralph | $4,500 | -- | |
| Cosbic Resources Inc | -- | -- | |
| P | $19,000 | -- | |
| Costley Realty & Development Co& Dr Jame | -- | -- |
Source: Public Records
Mortgage History
| Date | Status | Borrower | Loan Amount |
|---|---|---|---|
| Open | Pryor Richard L | $75,000 |
Source: Public Records
Tax History Compared to Growth
Tax History
| Year | Tax Paid | Tax Assessment Tax Assessment Total Assessment is a certain percentage of the fair market value that is determined by local assessors to be the total taxable value of land and additions on the property. | Land | Improvement |
|---|---|---|---|---|
| 2024 | $2,391 | $78,255 | $14,784 | $63,471 |
| 2023 | $2,239 | $75,112 | $13,440 | $61,672 |
| 2022 | $1,912 | $64,441 | $12,800 | $51,641 |
| 2021 | $1,496 | $49,556 | $6,400 | $43,156 |
| 2020 | $1,452 | $47,719 | $6,400 | $41,319 |
| 2019 | $1,376 | $45,809 | $6,400 | $39,409 |
| 2018 | $1,262 | $41,947 | $6,400 | $35,547 |
| 2017 | $1,206 | $41,007 | $6,400 | $34,607 |
| 2016 | $1,238 | $40,588 | $6,400 | $34,188 |
| 2015 | $1,211 | $40,588 | $6,400 | $34,188 |
| 2014 | $1,211 | $40,588 | $6,400 | $34,188 |
Source: Public Records
Map
Nearby Homes
- 0 College View Dr SW Unit 7648701
- 0 College View Dr SW Unit 7645215
- 0 College View Dr SW Unit 20148725
- 0 College View Dr SW Unit 20148724
- 0 Vanns Valley Rd SW Unit 10534224
- 0 Vanns Valley Rd SW Unit 7589183
- 65 Vanns Valley Rd SW
- 3667 Cave Spring Rd SW
- 514 Booze Mountain Rd SE
- 185 Marion Dairy Rd SE
- 26 The Trail SE
- 184 Conns Lake Extension
- 3904 Cave Spring Rd SW
- 0 Booze Mountain Rd Unit 10580353
- 81 Hughes Dairy Rd
- 1380 Old Cedartown Rd SE
- 407 Blackberry Ln SE
- 612 Eden Valley Rd SE
- 27 Hughes Dairy Rd SE
- 0 Walker Mountain Rd SW Unit 10531001
- 171 Welcome Hill Trail SW
- 178 Welcome Hill Trail SW
- 161 Welcome Hill Trail SW
- 198 Welcome Hill Trail SW
- 162 Welcome Hill Trail SW
- 151 Welcome Hill Trail SW
- 212 Welcome Hill Trail SW
- 141 Welcome Hill Trail SW
- 4 College View Dr SW
- 0 College View Dr SW Unit 8303050
- 0 College View Dr SW Unit 8040206
- 0 College View Dr SW Unit 7645207
- 0 College View Dr SW Unit 7391973
- 0 College View Dr SW Unit 7391966
- 0 College View Dr SW Unit 7280980
- 0 College View Dr SW Unit 7280972
- 0 College View Dr SW Unit 7152432
- 0 College View Dr SW Unit 10115548
- 0 College View Dr SW Unit 8771598
- 0 College View Dr SW Unit 3251007