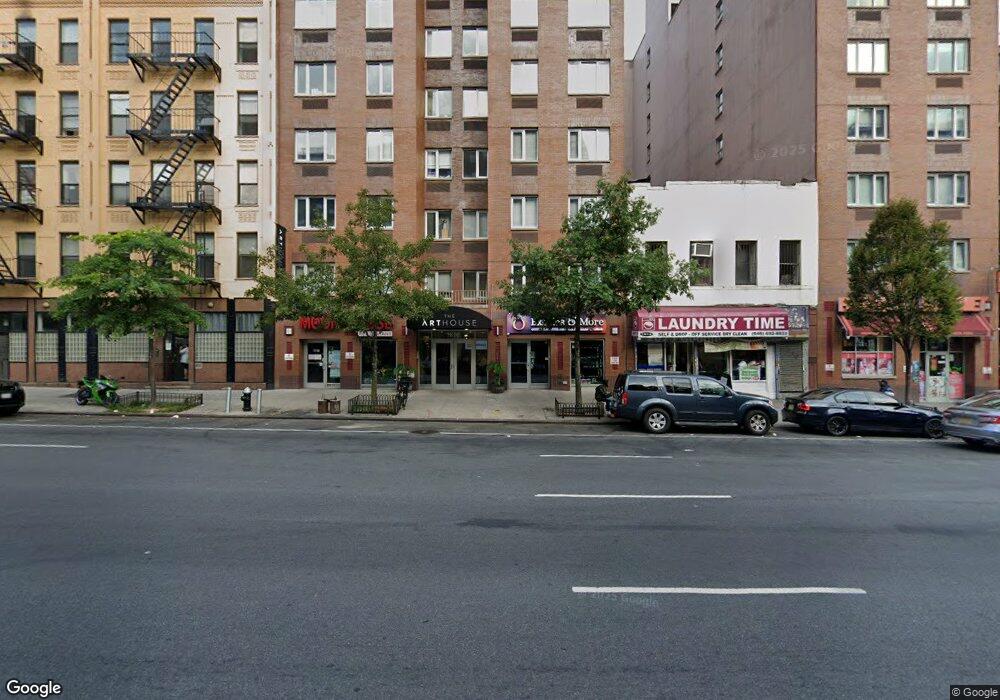
The Art House 1810 3rd Ave Unit 9B New York, NY 10029
East Harlem NeighborhoodEstimated Value: $575,000 - $666,000
--
Bed
--
Bath
650
Sq Ft
$939/Sq Ft
Est. Value
About This Home
This home is located at 1810 3rd Ave Unit 9B, New York, NY 10029 and is currently estimated at $610,565, approximately $939 per square foot. 1810 3rd Ave Unit 9B is a home located in New York County with nearby schools including Central Park East II, Global Technology Preparatory, and Isaac Newton Ms For Math And Science.
Ownership History
Date
Name
Owned For
Owner Type
Purchase Details
Closed on
Mar 13, 2025
Sold by
Riggs Taylor A
Bought by
Allais Alexandre Samuel and Laumonier Carole
Current Estimated Value
Purchase Details
Closed on
Feb 25, 2022
Sold by
Lenzi Teresa
Bought by
Riggs Taylor A
Purchase Details
Closed on
May 7, 2020
Sold by
Lenzi Teresa and Schmidt Andreas
Bought by
Lenzi Teresa
Home Financials for this Owner
Home Financials are based on the most recent Mortgage that was taken out on this home.
Original Mortgage
$242,714
Interest Rate
2.6%
Mortgage Type
Purchase Money Mortgage
Purchase Details
Closed on
Nov 26, 2018
Sold by
Katzman Alexander H
Bought by
Riggs Taylor A
Purchase Details
Closed on
Apr 19, 2017
Sold by
1810 3Rd Avenue Associates Llc
Bought by
Katzman Alexander H and Riggs Taylor A
Home Financials for this Owner
Home Financials are based on the most recent Mortgage that was taken out on this home.
Original Mortgage
$540,000
Interest Rate
4.21%
Mortgage Type
New Conventional
Create a Home Valuation Report for This Property
The Home Valuation Report is an in-depth analysis detailing your home's value as well as a comparison with similar homes in the area
Home Values in the Area
Average Home Value in this Area
Purchase History
| Date | Buyer | Sale Price | Title Company |
|---|---|---|---|
| Allais Alexandre Samuel | $540,000 | -- | |
| Riggs Taylor A | -- | -- | |
| Lenzi Teresa | -- | -- | |
| Riggs Taylor A | $20,000 | -- | |
| Katzman Alexander H | $600,000 | -- |
Source: Public Records
Mortgage History
| Date | Status | Borrower | Loan Amount |
|---|---|---|---|
| Previous Owner | Lenzi Teresa | $242,714 | |
| Previous Owner | Katzman Alexander H | $540,000 |
Source: Public Records
Tax History Compared to Growth
Tax History
| Year | Tax Paid | Tax Assessment Tax Assessment Total Assessment is a certain percentage of the fair market value that is determined by local assessors to be the total taxable value of land and additions on the property. | Land | Improvement |
|---|---|---|---|---|
| 2025 | $8,226 | $66,056 | $2,402 | $63,654 |
| 2024 | $8,226 | $65,794 | $2,403 | $63,392 |
| 2023 | $8,014 | $65,328 | $2,403 | $62,925 |
| 2022 | $6,470 | $64,102 | $2,402 | $61,700 |
| 2021 | $7,727 | $62,989 | $2,402 | $60,587 |
| 2020 | $6,662 | $69,735 | $2,402 | $67,333 |
| 2019 | $7,662 | $68,169 | $2,402 | $65,767 |
| 2018 | $5,743 | $65,547 | $2,402 | $63,145 |
| 2017 | $5,236 | $61,102 | $2,402 | $58,700 |
Source: Public Records
About The Art House
Map
Nearby Homes
- 1810 3rd Ave Unit B9C
- 1810 3rd Ave Unit 1
- 1810 3rd Ave Unit A7D
- 181 E 101 St Unit 602
- 181 E 101st St Unit 202
- 181 E 101st St Unit 808
- 181 E 101st St Unit 8022
- 181 E 101st St Unit 803
- 181 E 101st St Unit 809
- 1790 3rd Ave Unit 803
- 1790 3rd Ave Unit 405
- 1790 3rd Ave Unit 702
- 1595 Lexington Ave Unit 8C
- 1604 Lexington Ave
- 1341 Park Ave
- 114 E 98th St Unit 2E
- 215-217 E 96th St Unit 37B
- 215-217 E 96th St Unit 30B
- 215-217 E 96th St Unit 28L
- 215-217 E 96th St Unit 25B
- 1810 3rd Ave
- 1810 3rd Ave Unit A6A
- 1810 3rd Ave Unit 7B
- 1810 3rd Ave Unit 2A
- 1810 3rd Ave Unit 7D
- 1810 3rd Ave Unit 10C
- 1810 3rd Ave Unit 3B
- 1810 3rd Ave Unit 8D
- 1810 3rd Ave Unit 7A
- 1810 3rd Ave Unit 4B
- 1810 3rd Ave Unit 2B
- 1810 3rd Ave Unit 4C
- 1810 3rd Ave Unit 5C
- 1810 3rd Ave Unit 11D
- 1810 3rd Ave Unit 8B
- 1810 3rd Ave Unit 6A
- 1810 3rd Ave Unit 5B
- 1810 3rd Ave Unit 4A
- 1810 3rd Ave Unit 9A
- 1810 3rd Ave Unit 2C