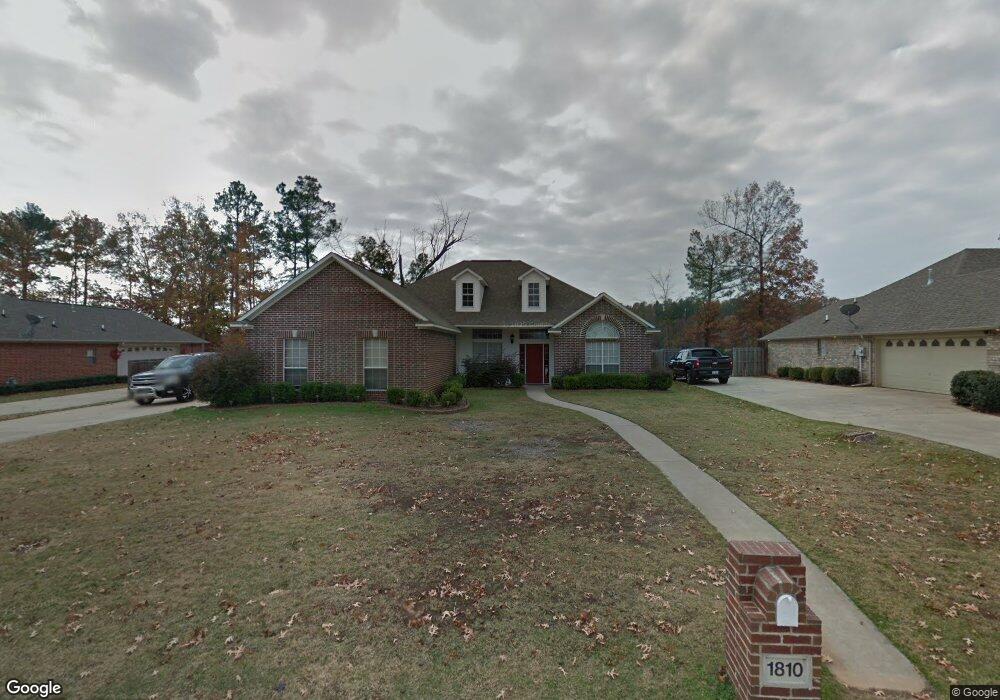
1810 Castle Oaks Texarkana, AR 71854
Estimated Value: $268,000 - $354,000
--
Bed
2
Baths
2,087
Sq Ft
$152/Sq Ft
Est. Value
About This Home
This home is located at 1810 Castle Oaks, Texarkana, AR 71854 and is currently estimated at $317,349, approximately $152 per square foot. 1810 Castle Oaks is a home located in Miller County with nearby schools including Arkansas High School, Trinity Christian School, and Veritas Academy.
Ownership History
Date
Name
Owned For
Owner Type
Purchase Details
Closed on
Jan 20, 2012
Sold by
Hartwell William E and Hartwell Kelly R
Bought by
Polite Lee Vell
Current Estimated Value
Home Financials for this Owner
Home Financials are based on the most recent Mortgage that was taken out on this home.
Original Mortgage
$146,812
Outstanding Balance
$99,773
Interest Rate
3.95%
Mortgage Type
VA
Estimated Equity
$217,576
Purchase Details
Closed on
Mar 24, 2005
Sold by
Bryant Arnold L and Bryant Lucretia
Bought by
Hartwell William E and Brule Kelly R
Home Financials for this Owner
Home Financials are based on the most recent Mortgage that was taken out on this home.
Original Mortgage
$167,500
Interest Rate
6%
Mortgage Type
New Conventional
Purchase Details
Closed on
May 3, 2004
Bought by
Bryant Arnold and Bryant L
Purchase Details
Closed on
Jul 3, 2003
Bought by
Bryant Arnold and Bryant Lucretia
Create a Home Valuation Report for This Property
The Home Valuation Report is an in-depth analysis detailing your home's value as well as a comparison with similar homes in the area
Home Values in the Area
Average Home Value in this Area
Purchase History
| Date | Buyer | Sale Price | Title Company |
|---|---|---|---|
| Polite Lee Vell | $185,000 | Southwest Title Company | |
| Hartwell William E | $168,000 | None Available | |
| Bryant Arnold | -- | -- | |
| Bryant Arnold | $23,000 | -- |
Source: Public Records
Mortgage History
| Date | Status | Borrower | Loan Amount |
|---|---|---|---|
| Open | Polite Lee Vell | $146,812 | |
| Previous Owner | Hartwell William E | $167,500 |
Source: Public Records
Tax History Compared to Growth
Tax History
| Year | Tax Paid | Tax Assessment Tax Assessment Total Assessment is a certain percentage of the fair market value that is determined by local assessors to be the total taxable value of land and additions on the property. | Land | Improvement |
|---|---|---|---|---|
| 2025 | $2,565 | $53,730 | $6,400 | $47,330 |
| 2024 | $2,332 | $40,630 | $6,400 | $34,230 |
| 2023 | $1,806 | $40,630 | $6,400 | $34,230 |
| 2022 | $1,856 | $40,630 | $6,400 | $34,230 |
| 2021 | $1,856 | $40,630 | $6,400 | $34,230 |
| 2020 | $1,847 | $40,630 | $6,400 | $34,230 |
| 2019 | $1,766 | $38,540 | $6,400 | $32,140 |
| 2018 | $1,766 | $38,540 | $6,400 | $32,140 |
| 2017 | $1,766 | $38,540 | $6,400 | $32,140 |
| 2016 | $1,766 | $38,540 | $6,400 | $32,140 |
| 2015 | $1,766 | $38,540 | $6,400 | $32,140 |
| 2014 | $1,680 | $36,970 | $6,400 | $30,570 |
Source: Public Records
Map
Nearby Homes
- 6005 Timberwood Ln
- 6021 Summerwood Ln
- 4.94 Acres Mount Olive Dr
- 6133 Timberwood Ln
- 5909 Forest Bend Ln
- 6410 Timbercreek Dr
- 5606 Cliffwood Dr
- 5902 Oak Hollow Place
- 5511 Woodline Dr
- 3707 McDonald Ln
- TBD Trinity Blvd
- 2106 Southcrest Dr
- 5102 Sanderson Ln
- 0 Sugarhill Rd Unit 113021
- 0 Sugarhill Rd Unit 25046840
- 1806 E 50th St
- 4900 Kennedy Place
- 6912 Sugarhill Acres Dr
- 3202 E 50th St
- 2010 E 47th St
- 1814 Castle Oaks
- 1806 Castle Oaks
- 1804 Castle Oaks
- 1818 Castle Oaks
- 1805 Castle Oaks
- 1801 Castle Oaks
- 1802 Castle Oaks
- 1902 Castle Oaks
- 6009 Timberwood Ln
- 6006 Timberwood Ln
- 1721 Castle Oaks
- 0 Oak Hollow Ln Unit 20017109
- 1800 Castle Oaks
- 1906 Castle Oaks
- 1806 McDonald Ln
- 6010 Timberwood Ln
- 1802 McDonald Ln
- 6013 Timberwood Ln
- 1713 Castle Oaks
- 6005 Castle Oaks