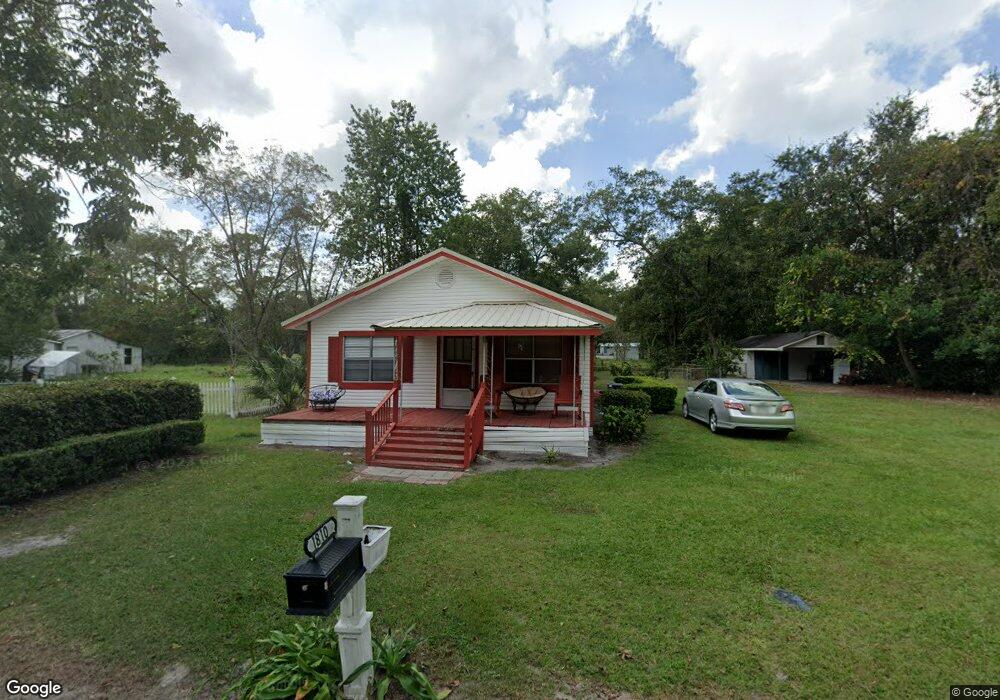
1810 Creswell St Waycross, GA 31503
Estimated Value: $93,000 - $121,000
2
Beds
3
Baths
1,144
Sq Ft
$95/Sq Ft
Est. Value
About This Home
This home is located at 1810 Creswell St, Waycross, GA 31503 and is currently estimated at $108,158, approximately $94 per square foot. 1810 Creswell St is a home located in Ware County with nearby schools including Memorial Drive Elementary School, Waycross Middle School, and Ware County High School.
Ownership History
Date
Name
Owned For
Owner Type
Purchase Details
Closed on
Apr 18, 2023
Sold by
Lazalde Juan Jose Aldaba
Bought by
Aldaba John M
Current Estimated Value
Purchase Details
Closed on
Feb 8, 2019
Sold by
Sirmons Kathryn L
Bought by
Lazalde Juan Jose Aldaba and Aldaba Gloria Anahi
Purchase Details
Closed on
Sep 10, 2018
Sold by
Sirmons Manuel
Bought by
Sirmons Kathryn
Purchase Details
Closed on
Jan 14, 2015
Sold by
Milton Ray
Bought by
Sirmons Manuel Lester and Sirmons Kathryn
Purchase Details
Closed on
Jul 31, 2006
Sold by
Haynes Marvin H
Bought by
Stout Deina R
Home Financials for this Owner
Home Financials are based on the most recent Mortgage that was taken out on this home.
Original Mortgage
$50,350
Interest Rate
10.58%
Mortgage Type
New Conventional
Purchase Details
Closed on
Feb 11, 2005
Sold by
Haynes Mary
Bought by
Haynes Marvin H
Create a Home Valuation Report for This Property
The Home Valuation Report is an in-depth analysis detailing your home's value as well as a comparison with similar homes in the area
Home Values in the Area
Average Home Value in this Area
Purchase History
| Date | Buyer | Sale Price | Title Company |
|---|---|---|---|
| Aldaba John M | -- | -- | |
| Lazalde Juan Jose Aldaba | $45,000 | -- | |
| Sirmons Kathryn | -- | -- | |
| Sirmons Manuel Lester | $30,000 | -- | |
| Stout Deina R | $53,000 | -- | |
| Haynes Marvin H | -- | -- |
Source: Public Records
Mortgage History
| Date | Status | Borrower | Loan Amount |
|---|---|---|---|
| Previous Owner | Stout Deina R | $50,350 |
Source: Public Records
Tax History Compared to Growth
Tax History
| Year | Tax Paid | Tax Assessment Tax Assessment Total Assessment is a certain percentage of the fair market value that is determined by local assessors to be the total taxable value of land and additions on the property. | Land | Improvement |
|---|---|---|---|---|
| 2024 | $1,091 | $36,158 | $6,840 | $29,318 |
| 2023 | $1,247 | $22,388 | $2,190 | $20,198 |
| 2022 | $892 | $22,388 | $2,190 | $20,198 |
| 2021 | $742 | $17,158 | $2,190 | $14,968 |
| 2020 | $738 | $16,924 | $2,190 | $14,734 |
| 2019 | $0 | $15,451 | $2,190 | $13,261 |
| 2018 | $0 | $14,889 | $2,190 | $12,699 |
| 2017 | -- | $14,889 | $2,190 | $12,699 |
| 2016 | -- | $14,889 | $2,190 | $12,699 |
| 2015 | $587 | $14,889 | $2,190 | $12,699 |
| 2014 | $653 | $14,889 | $2,190 | $12,699 |
| 2013 | -- | $15,707 | $2,190 | $13,517 |
Source: Public Records
Map
Nearby Homes
- 1808 Brunel St
- 201 Washington Ave
- 2204 & 2210 Gibbs St
- 1500 Georgia Ave
- 1304 Brunel St
- 0 Kentucky Ave
- 1021 Lee Ave
- 0 Cabinet St
- 805 Brunel St
- 615 Morton Ave
- 705 Gilmore St
- 1125 Georgia St
- 1103 Ann St
- 1721 Minnesota Ave
- 0 Swamp Rd
- 1208 Margaret St
- 803 Elizabeth St
- 306 Lee Ave
- 418 Reed St
- 0 S Georgia Pkwy W
- 1802 Creswell St
- 1814 Creswell St
- 0 Montgomery St Unit 1649661
- 0000 Montgomery St
- 0 Montgomery St Unit n/a 109478
- 0 Montgomery St
- 1804 Montgomery St
- 1810 Montgomery St
- 601 Washington Ave
- 701 Washington Ave
- 1003 Holmes St
- 0 Holmes St
- 1900 Creswell St
- 1815 Creswell St
- 1801 Creswell St
- 1807 Gibbs St
- 1819 Montgomery St
- 1904 Creswell St
- 503 Holmes St
- 505 Washington Ave