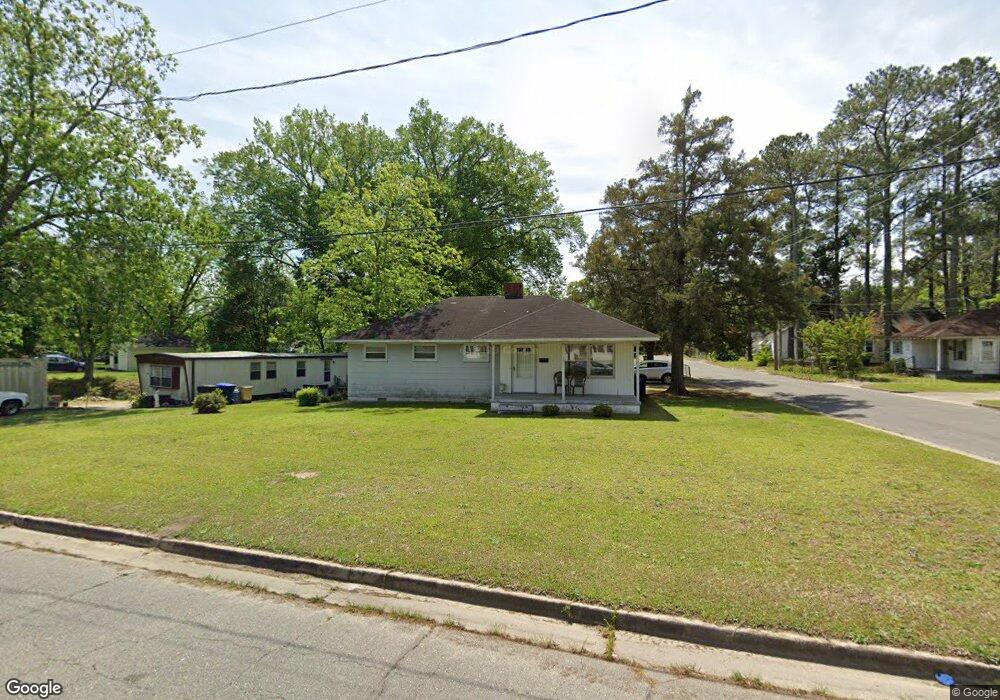
1810 Dupree St Kinston, NC 28504
Estimated Value: $72,000 - $96,112
2
Beds
1
Bath
1,025
Sq Ft
$77/Sq Ft
Est. Value
About This Home
This home is located at 1810 Dupree St, Kinston, NC 28504 and is currently estimated at $79,028, approximately $77 per square foot. 1810 Dupree St is a home located in Lenoir County with nearby schools including Northwest Elementary School, Rochelle Middle School, and Kinston High School.
Ownership History
Date
Name
Owned For
Owner Type
Purchase Details
Closed on
Apr 26, 2023
Sold by
Dobbs Llc
Bought by
Estrada Home Improvements Llc
Current Estimated Value
Purchase Details
Closed on
Aug 20, 2020
Sold by
Kornnegay Nick Deens and Kornegay Leslie H
Bought by
Dobbs Llc
Purchase Details
Closed on
May 12, 2009
Sold by
Secretary Of Hud
Bought by
Kornegay Nick D
Home Financials for this Owner
Home Financials are based on the most recent Mortgage that was taken out on this home.
Original Mortgage
$10,000
Interest Rate
4.79%
Mortgage Type
Purchase Money Mortgage
Purchase Details
Closed on
May 8, 2009
Sold by
Kornegay Nick D and Kornegay Glenda
Bought by
Kornegay Ii Nick Deens and Kornegay Downey Ida Jo
Home Financials for this Owner
Home Financials are based on the most recent Mortgage that was taken out on this home.
Original Mortgage
$10,000
Interest Rate
4.79%
Mortgage Type
Purchase Money Mortgage
Create a Home Valuation Report for This Property
The Home Valuation Report is an in-depth analysis detailing your home's value as well as a comparison with similar homes in the area
Home Values in the Area
Average Home Value in this Area
Purchase History
| Date | Buyer | Sale Price | Title Company |
|---|---|---|---|
| Estrada Home Improvements Llc | $30,500 | None Listed On Document | |
| Dobbs Llc | $265,000 | None Available | |
| Kornegay Nick D | -- | -- | |
| Kornegay Ii Nick Deens | -- | -- |
Source: Public Records
Mortgage History
| Date | Status | Borrower | Loan Amount |
|---|---|---|---|
| Previous Owner | Kornegay Nick D | $10,000 |
Source: Public Records
Tax History Compared to Growth
Tax History
| Year | Tax Paid | Tax Assessment Tax Assessment Total Assessment is a certain percentage of the fair market value that is determined by local assessors to be the total taxable value of land and additions on the property. | Land | Improvement |
|---|---|---|---|---|
| 2025 | $804 | $57,207 | $8,295 | $48,912 |
| 2024 | $454 | $28,091 | $9,000 | $19,091 |
| 2023 | $454 | $28,091 | $9,000 | $19,091 |
| 2022 | $454 | $28,091 | $9,000 | $19,091 |
| 2021 | $454 | $28,091 | $9,000 | $19,091 |
| 2020 | $442 | $28,091 | $9,000 | $19,091 |
| 2019 | $442 | $28,091 | $9,000 | $19,091 |
| 2018 | $430 | $28,091 | $9,000 | $19,091 |
| 2017 | $431 | $28,091 | $9,000 | $19,091 |
| 2014 | $637 | $42,589 | $9,000 | $33,589 |
| 2013 | -- | $42,589 | $9,000 | $33,589 |
| 2011 | -- | $42,589 | $9,000 | $33,589 |
Source: Public Records
Map
Nearby Homes
- 1000 Oriental Ave
- 1303 W Washington Ave
- 604 Hines Ave
- 1704 Sunset Ave
- 809 Greenbriar Rd
- 1700 Dubose Dr
- 1200 W Lenoir Ave
- 3 Sweetbriar Cir
- 1324 S Wilshire Ct
- 1301 Par Dr
- 1003 W Washington Ave
- 1505 Saint James Place
- 1205 W Highland Ave
- 1601 Cambridge Dr
- 1404 Carey Rd
- 708 W Lenoir Ave
- 608 Rhem St
- 605 W Lenoir Ave
- 1900 Greenbriar Rd
- 510 W Washington Ave
- 1808 Dupree St
- 605 Spence Dr
- 1814 Dupree St
- 608 Spence Dr
- 1804 Dupree St
- 606 Spence Dr
- 603 Spence Dr
- 1809 Dupree St
- 1816 Dupree St
- 1811 Dupree St
- 1807 Dupree St
- 602 Spence Dr
- 1802 Dupree St
- 602 Westover Ave
- 601 Spence Dr
- 1805 Dupree St
- 1818 Dupree St
- 600 Spence Dr
- 1803 W Washington Ave
- 703 Hardee Rd