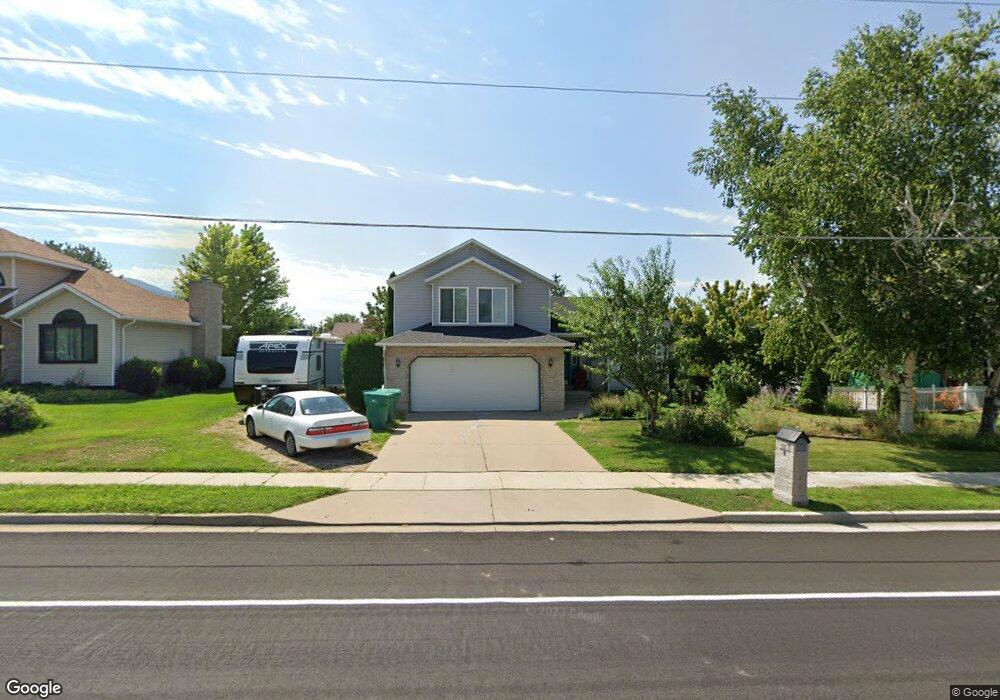
1810 E Cherry Ln Layton, UT 84040
Estimated Value: $501,000 - $536,000
5
Beds
2
Baths
2,158
Sq Ft
$239/Sq Ft
Est. Value
About This Home
This home is located at 1810 E Cherry Ln, Layton, UT 84040 and is currently estimated at $516,033, approximately $239 per square foot. 1810 E Cherry Ln is a home located in Davis County with nearby schools including East Layton Elementary School, Central Davis Junior High School, and Layton High School.
Ownership History
Date
Name
Owned For
Owner Type
Purchase Details
Closed on
Apr 20, 2012
Sold by
Swann Michael D and Swann Jennifer F
Bought by
Swann Jennifer F and Swann Michael D
Current Estimated Value
Home Financials for this Owner
Home Financials are based on the most recent Mortgage that was taken out on this home.
Original Mortgage
$151,200
Outstanding Balance
$104,386
Interest Rate
3.9%
Mortgage Type
New Conventional
Estimated Equity
$411,647
Purchase Details
Closed on
May 26, 2004
Sold by
Derico Ra Nae
Bought by
Swann Michael D and Swann Jennifer F
Home Financials for this Owner
Home Financials are based on the most recent Mortgage that was taken out on this home.
Original Mortgage
$155,800
Interest Rate
5.87%
Mortgage Type
Purchase Money Mortgage
Purchase Details
Closed on
Dec 16, 1995
Sold by
Thompson Stephen D
Bought by
Derico Ra Nae
Home Financials for this Owner
Home Financials are based on the most recent Mortgage that was taken out on this home.
Original Mortgage
$30,000
Interest Rate
7.38%
Create a Home Valuation Report for This Property
The Home Valuation Report is an in-depth analysis detailing your home's value as well as a comparison with similar homes in the area
Home Values in the Area
Average Home Value in this Area
Purchase History
| Date | Buyer | Sale Price | Title Company |
|---|---|---|---|
| Swann Jennifer F | -- | Bonneville Superior | |
| Swann Michael D | -- | Equity Title Agency | |
| Derico Ra Nae | -- | Associated Title Company |
Source: Public Records
Mortgage History
| Date | Status | Borrower | Loan Amount |
|---|---|---|---|
| Open | Swann Jennifer F | $151,200 | |
| Closed | Swann Michael D | $155,800 | |
| Previous Owner | Derico Ra Nae | $30,000 |
Source: Public Records
Tax History
| Year | Tax Paid | Tax Assessment Tax Assessment Total Assessment is a certain percentage of the fair market value that is determined by local assessors to be the total taxable value of land and additions on the property. | Land | Improvement |
|---|---|---|---|---|
| 2025 | $2,326 | $244,200 | $123,792 | $120,408 |
| 2024 | $2,174 | $229,900 | $147,746 | $82,154 |
| 2023 | $2,227 | $415,000 | $199,490 | $215,510 |
| 2022 | $2,309 | $233,750 | $106,981 | $126,769 |
| 2021 | $2,392 | $361,000 | $162,775 | $198,225 |
| 2020 | $1,899 | $275,000 | $131,643 | $143,357 |
| 2019 | $1,840 | $261,000 | $117,631 | $143,369 |
| 2018 | $1,686 | $240,000 | $91,447 | $148,553 |
| 2016 | $1,574 | $115,610 | $37,011 | $78,599 |
| 2015 | $1,538 | $107,250 | $37,011 | $70,239 |
| 2014 | $1,572 | $112,051 | $37,011 | $75,040 |
| 2013 | -- | $109,860 | $26,549 | $83,311 |
Source: Public Records
Map
Nearby Homes
- 1843 Hayes Dr
- 1975 E 1425 N
- 1476 Kays Creek Dr
- 2124 E Cherry Ln
- 1148 N 1875 E Unit 2
- 1350 Kays Creek Dr
- 2113 E 1200 N
- 1156 Cherrywood Dr
- 1354 E Hollyhock Way
- 1340 E Hollyhock Way
- 1540 E Primrose Ln
- 1465 E Sego Lily Ct
- 1258 E North Lisa St
- 1305 E Larkspur Way
- 1907 N Bridge Ct
- 2203 E 1200 N
- 1266 E Larkspur Way
- 1545 E 975 N
- 2391 Kays Creek Dr
- 2096 N 1450 E
- 1828 E Cherry Ln
- 1819 Crestwood Rd
- 1803 Crestwood Rd
- 1752 E Cherry Ln
- 1843 Crestwood Rd
- 1846 E Cherry Ln
- 1785 E Cherry Ln
- 1785 E Crestwood St
- 1785 E 1425 N
- 1785 Crestwood Rd
- 1763 E Cherry Ln
- 1751 Hillsboro Dr
- 1810 Crestwood Rd
- 1840 Crestwood Rd
- 1463 Child Dr
- 1463 N 1875 E
- 1485 Child Dr
- 1813 E Cherry Ln
- 1796 Crestwood Rd
- 1743 Hillsboro Dr
Your Personal Tour Guide
Ask me questions while you tour the home.