1810 Half Moon Bay Dr Croton On Hudson, NY 10520
Estimated Value: $378,859 - $870,000
2
Beds
2
Baths
1,350
Sq Ft
$463/Sq Ft
Est. Value
About This Home
This home is located at 1810 Half Moon Bay Dr, Croton On Hudson, NY 10520 and is currently estimated at $624,965, approximately $462 per square foot. 1810 Half Moon Bay Dr is a home located in Westchester County with nearby schools including Carrie E Tompkins School, Pierre Van Cortlandt Middle School, and St. Augustine School.
Ownership History
Date
Name
Owned For
Owner Type
Purchase Details
Closed on
Aug 1, 2016
Sold by
Eren Selcuk and Yin Na
Bought by
Gardener Keith
Current Estimated Value
Home Financials for this Owner
Home Financials are based on the most recent Mortgage that was taken out on this home.
Original Mortgage
$284,000
Outstanding Balance
$226,599
Interest Rate
3.48%
Mortgage Type
Commercial
Estimated Equity
$398,366
Purchase Details
Closed on
Aug 28, 2009
Sold by
Shih Peter Chin and Ng Man Yi Cindy
Bought by
Eren Selcuk
Home Financials for this Owner
Home Financials are based on the most recent Mortgage that was taken out on this home.
Original Mortgage
$315,000
Interest Rate
5.36%
Mortgage Type
Commercial
Purchase Details
Closed on
Dec 19, 2002
Sold by
Hudson Property Partners Llc
Bought by
Shih Peter Chin and Ng Man Yi Cindy
Create a Home Valuation Report for This Property
The Home Valuation Report is an in-depth analysis detailing your home's value as well as a comparison with similar homes in the area
Home Values in the Area
Average Home Value in this Area
Purchase History
| Date | Buyer | Sale Price | Title Company |
|---|---|---|---|
| Gardener Keith | $355,000 | New Age Title Agency | |
| Eren Selcuk | $350,000 | Thoroughbred Title Services | |
| Shih Peter Chin | $222,357 | -- |
Source: Public Records
Mortgage History
| Date | Status | Borrower | Loan Amount |
|---|---|---|---|
| Open | Gardener Keith | $284,000 | |
| Previous Owner | Eren Selcuk | $315,000 |
Source: Public Records
Tax History Compared to Growth
Tax History
| Year | Tax Paid | Tax Assessment Tax Assessment Total Assessment is a certain percentage of the fair market value that is determined by local assessors to be the total taxable value of land and additions on the property. | Land | Improvement |
|---|---|---|---|---|
| 2024 | $6,192 | $2,646 | $730 | $1,916 |
| 2023 | $6,064 | $2,646 | $730 | $1,916 |
| 2022 | $5,954 | $2,646 | $730 | $1,916 |
| 2021 | $5,848 | $2,646 | $730 | $1,916 |
| 2020 | $5,768 | $2,646 | $730 | $1,916 |
| 2019 | $4,745 | $2,646 | $730 | $1,916 |
| 2018 | $7,205 | $2,646 | $730 | $1,916 |
| 2017 | $777 | $2,646 | $730 | $1,916 |
| 2016 | $5,493 | $2,646 | $730 | $1,916 |
| 2015 | -- | $2,646 | $730 | $1,916 |
| 2014 | -- | $2,646 | $730 | $1,916 |
| 2013 | -- | $2,646 | $730 | $1,916 |
Source: Public Records
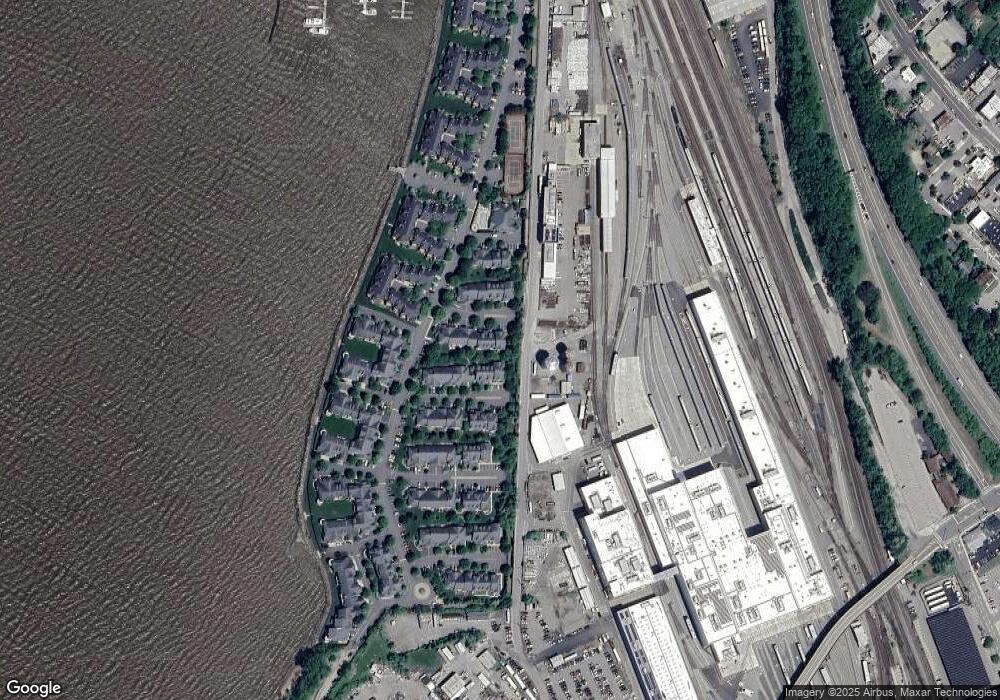
Map
Nearby Homes
- 1706 Half Moon Bay Dr Unit 1706
- 1200 Half Moon Bay Dr
- 34 Ridge Rd
- 38 Nordica Dr
- 25 S Riverside Ave Unit 201
- 25 S Riverside Ave Unit 308
- 25 S Riverside Ave Unit 108
- 25 S Riverside Ave Unit 211
- 56 Irving Ave
- 35 Brook St
- 102 Maple St
- 19 Hunter St
- 43 High St
- 72 Old Post Rd N
- D-20 Half Moon Bay Marina
- B-11 Half Moon Bay Marina Unit B-11
- 170 Grand St
- 9 High Ridge Rd
- 99 Quaker Bridge Rd
- 1 Wood Rd
- 1810 Half Moon Bay Dr Unit 1810
- 1809 Half Moon Bay Dr
- 1805 Half Moon Bay Dr
- 1804 Half Moon Bay Dr
- 1804 Half Moon Bay Dr Unit 1804
- 1807 Half Moon Bay Dr
- 1806 Half Moon Bay Dr Unit 1806
- 1806 Half Moon Bay Dr
- 1707 Half Moon Bay Dr
- 1803 Half Moon Bay Dr Unit 1803
- 1708 Half Moon Bay Dr Unit 1708
- 1708 Half Moon Bay Dr
- 1710 Half Moon Bay Dr
- 1706 Half Moon Bay Dr
- F29 Half Moon Bay Dr
- B23 Half Moon Bay Dr
- D25 Half Moon Bay Dr
- B17 Half Moon Bay Dr
- D18 Half Moon Bay Dr
- 1704 Half Moon Bay Dr