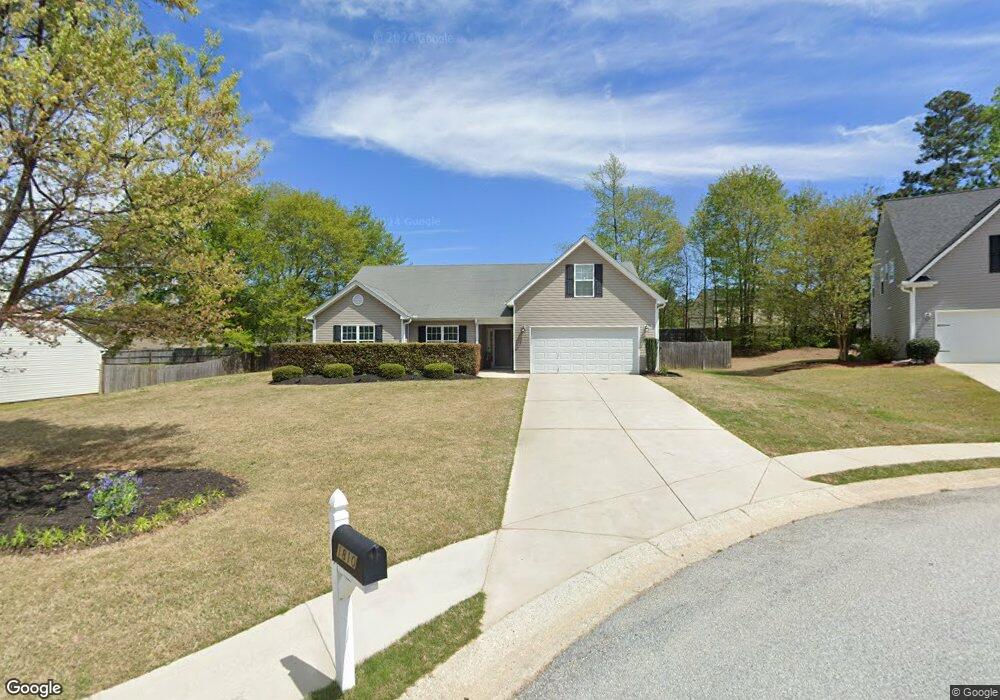
1810 Maxey Ln Unit 10H Winder, GA 30680
Estimated Value: $341,501 - $360,000
--
Bed
2
Baths
1,778
Sq Ft
$198/Sq Ft
Est. Value
About This Home
This home is located at 1810 Maxey Ln Unit 10H, Winder, GA 30680 and is currently estimated at $351,875, approximately $197 per square foot. 1810 Maxey Ln Unit 10H is a home located in Barrow County with nearby schools including Yargo Elementary School, Haymon-Morris Middle School, and Apalachee High School.
Ownership History
Date
Name
Owned For
Owner Type
Purchase Details
Closed on
Feb 24, 2020
Sold by
Smith Jason A
Bought by
Obrofta Jennifer Ann
Current Estimated Value
Home Financials for this Owner
Home Financials are based on the most recent Mortgage that was taken out on this home.
Original Mortgage
$207,178
Outstanding Balance
$183,486
Interest Rate
3.5%
Mortgage Type
FHA
Estimated Equity
$168,389
Purchase Details
Closed on
Aug 22, 2008
Sold by
Roxeywood Hms Llc
Bought by
Smith Jason A and Smith Kelli A
Home Financials for this Owner
Home Financials are based on the most recent Mortgage that was taken out on this home.
Original Mortgage
$154,163
Interest Rate
6.32%
Mortgage Type
FHA
Purchase Details
Closed on
May 19, 2008
Sold by
Sunrise Development Of Georgia
Bought by
Roxeywood Homes Llc
Purchase Details
Closed on
Jul 28, 2005
Sold by
Hodges James Alexand
Bought by
Sunrise Development Of Georgia Llc
Create a Home Valuation Report for This Property
The Home Valuation Report is an in-depth analysis detailing your home's value as well as a comparison with similar homes in the area
Home Values in the Area
Average Home Value in this Area
Purchase History
| Date | Buyer | Sale Price | Title Company |
|---|---|---|---|
| Obrofta Jennifer Ann | $211,000 | -- | |
| Smith Jason A | $155,000 | -- | |
| Roxeywood Homes Llc | $50,000 | -- | |
| Sunrise Development Of Georgia Llc | $4,758,700 | -- |
Source: Public Records
Mortgage History
| Date | Status | Borrower | Loan Amount |
|---|---|---|---|
| Open | Obrofta Jennifer Ann | $207,178 | |
| Previous Owner | Smith Jason A | $154,163 |
Source: Public Records
Tax History Compared to Growth
Tax History
| Year | Tax Paid | Tax Assessment Tax Assessment Total Assessment is a certain percentage of the fair market value that is determined by local assessors to be the total taxable value of land and additions on the property. | Land | Improvement |
|---|---|---|---|---|
| 2024 | $2,879 | $114,613 | $28,800 | $85,813 |
| 2023 | $2,876 | $115,013 | $28,800 | $86,213 |
| 2022 | $2,524 | $86,463 | $23,200 | $63,263 |
| 2021 | $2,214 | $71,224 | $18,800 | $52,424 |
| 2020 | $2,082 | $70,132 | $16,000 | $54,132 |
| 2019 | $2,022 | $67,796 | $16,000 | $51,796 |
| 2018 | $1,559 | $54,399 | $12,000 | $42,399 |
| 2017 | $1,504 | $51,672 | $12,000 | $39,672 |
| 2016 | $1,299 | $46,819 | $15,200 | $31,619 |
| 2015 | $1,315 | $47,152 | $15,200 | $31,952 |
| 2014 | $1,173 | $42,084 | $9,800 | $32,284 |
| 2013 | -- | $39,702 | $9,800 | $29,902 |
Source: Public Records
Map
Nearby Homes
- 1898 Roxey Ln
- 494 Otway Loop
- 474 Otway Loop
- 480 Roxeywood Way
- The Crawford Plan at Roxeywood Park
- The Bradley Plan at Roxeywood Park
- The Ellijay Plan at Roxeywood Park
- The Caldwell Plan at Roxeywood Park
- 57 Roxeywood Way
- The McGinnis Plan at Roxeywood Park
- The Coleman Plan at Roxeywood Park
- The Harrington Plan at Roxeywood Park
- 303 Roxeywood Way
- 1185 Wendy Way
- 219 Roxeywood Way
- 921 Roxeywood Dr
- Brandon Plan at Willowbrook
- ANSLEY Express Plan at Willowbrook
- HAYDEN Express Plan at Willowbrook
- ARIA Express Plan at Willowbrook
- 1810 Maxey Ln
- 1810 Maxex Ln
- 1808 Maxey Ln
- 1812 Maxey Ln
- 1419 Cragston Dr
- 1421 Cragston Dr
- 1806 Maxey Ln
- 1417 Cragston Dr
- 1423 Cragston Dr
- 1814 Maxey Ln
- 1415 Cragston Dr
- 1809 Maxey Ln
- 1809 Maxey Ln Unit 15
- 1811 Maxey Ln Unit 14
- 1811 Maxey Ln
- 1425 Cragston Dr
- 1804 Maxey Ln Unit 2 LOT 7
- 1807 Maxey Ln Unit 2/16H
- 1807 Maxey Ln
- 1813 Maxey Ln