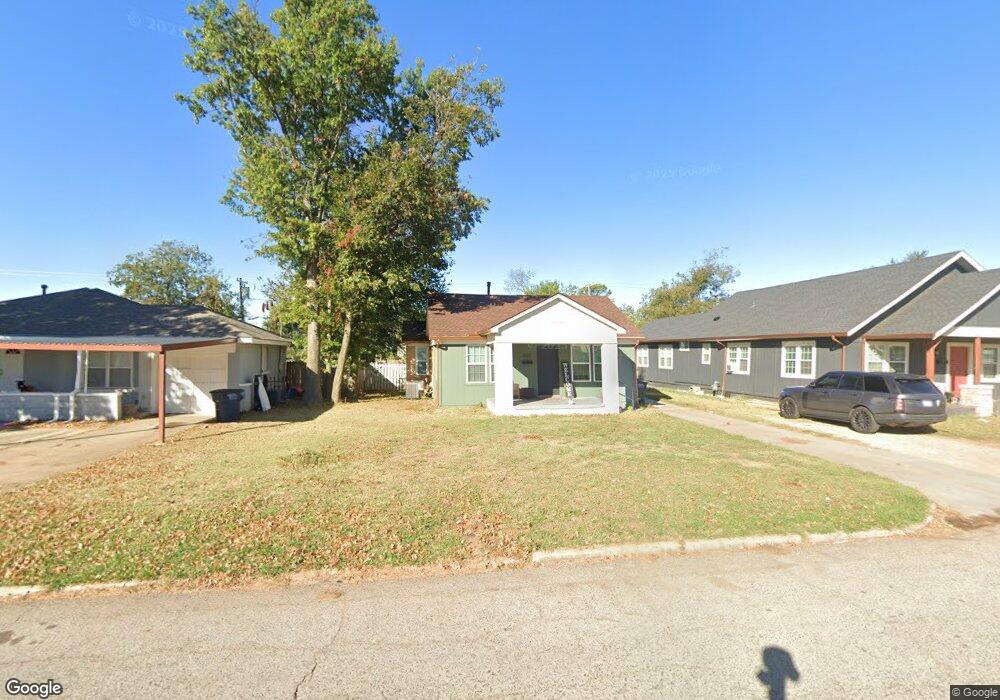
1810 N Park Ave Shawnee, OK 74804
Estimated Value: $99,000 - $131,000
3
Beds
2
Baths
1,517
Sq Ft
$78/Sq Ft
Est. Value
About This Home
This home is located at 1810 N Park Ave, Shawnee, OK 74804 and is currently estimated at $118,479, approximately $78 per square foot. 1810 N Park Ave is a home located in Pottawatomie County with nearby schools including Will Rogers Elementary School, Shawnee Middle School, and Shawnee High School.
Ownership History
Date
Name
Owned For
Owner Type
Purchase Details
Closed on
Nov 2, 2021
Sold by
Stark Cullison Calvin
Bought by
Cullison Randy Allen
Current Estimated Value
Home Financials for this Owner
Home Financials are based on the most recent Mortgage that was taken out on this home.
Original Mortgage
$104,800
Outstanding Balance
$95,775
Interest Rate
2.8%
Mortgage Type
Construction
Estimated Equity
$22,704
Purchase Details
Closed on
Oct 28, 2021
Sold by
Cullison Randy Aiien and Cullison Peggy
Bought by
Jbt Llc
Home Financials for this Owner
Home Financials are based on the most recent Mortgage that was taken out on this home.
Original Mortgage
$104,800
Outstanding Balance
$95,775
Interest Rate
2.8%
Mortgage Type
Construction
Estimated Equity
$22,704
Purchase Details
Closed on
Mar 28, 1996
Sold by
Davis Ruby and Davis Jesse
Bought by
Cullison Calvin and Cullison Helen
Purchase Details
Closed on
Aug 19, 1993
Sold by
Weeks Vivian
Bought by
Head Jewell
Create a Home Valuation Report for This Property
The Home Valuation Report is an in-depth analysis detailing your home's value as well as a comparison with similar homes in the area
Home Values in the Area
Average Home Value in this Area
Purchase History
| Date | Buyer | Sale Price | Title Company |
|---|---|---|---|
| Cullison Randy Allen | -- | -- | |
| Jbt Llc | $63,000 | Oklahoma City Abstract & Ttl | |
| Cullison Randy Allen | -- | -- | |
| Cullison Calvin | $34,000 | -- | |
| Head Jewell | $40,000 | -- |
Source: Public Records
Mortgage History
| Date | Status | Borrower | Loan Amount |
|---|---|---|---|
| Open | Jbt Llc | $104,800 |
Source: Public Records
Tax History Compared to Growth
Tax History
| Year | Tax Paid | Tax Assessment Tax Assessment Total Assessment is a certain percentage of the fair market value that is determined by local assessors to be the total taxable value of land and additions on the property. | Land | Improvement |
|---|---|---|---|---|
| 2024 | $790 | $7,938 | $636 | $7,302 |
| 2023 | $790 | $7,560 | $626 | $6,934 |
| 2022 | $776 | $7,560 | $626 | $6,934 |
| 2021 | $352 | $7,148 | $630 | $6,518 |
| 2020 | $340 | $4,363 | $630 | $3,733 |
| 2019 | $338 | $4,236 | $630 | $3,606 |
| 2018 | $318 | $4,112 | $630 | $3,482 |
| 2017 | $302 | $3,993 | $630 | $3,363 |
| 2016 | $293 | $3,876 | $630 | $3,246 |
| 2015 | $276 | $3,764 | $630 | $3,134 |
| 2014 | $265 | $3,654 | $630 | $3,024 |
Source: Public Records
Map
Nearby Homes
- 1834 N Market Ave
- 1710 N Park Ave
- 1925 N Park Ave
- 1607 N Beard Ave
- 1817 N Bell Ave
- 1816 N Bell Ave
- 2021 N Broadway Ave
- 2106 N Aydelotte Ave
- 1901 N Bell Ave
- 202 W Franklin St
- 1324 N Park Ave
- 1822 N Philadelphia Ave
- 210 E Cammack
- 1510 N Union Ave
- 10 W Midland St
- 216 W Georgia St
- 1217 N Market Ave
- 9 E Chicago St
- 1712 N Pennsylvania Ave
- 1006 N Market Ave
- 1822 N Park Ave
- 1802 N Park Ave
- 1824 N Park Ave
- 1815 N Louisa Ave
- 1817 N Park Ave
- 1823 N Louisa Ave
- 1815 N Park Ave
- 1819 N Park Ave
- 1805 N Louisa Ave
- 1809 N Park Ave
- 1825 N Louisa Ave
- 1804 N Park Ave
- 1825 N Park Ave
- 1828 N Park Ave
- 1827 N Louisa Ave
- 1827 N Park Ave
- 1801 N Park Ave
- 1829 N Louisa Ave
- 1831 N Park Ave