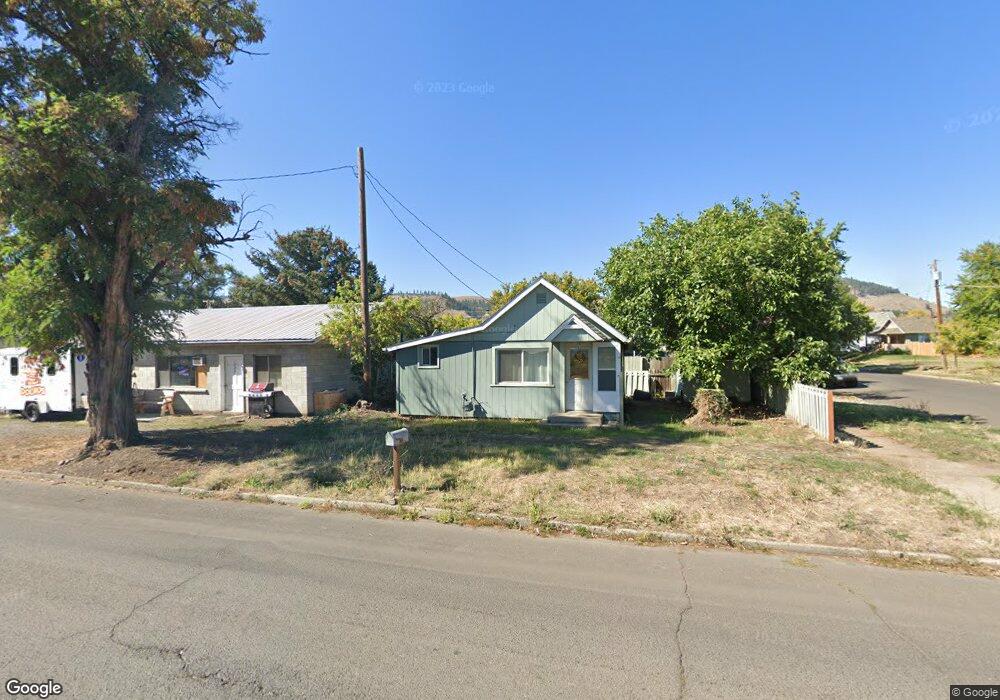
1810 N Spruce St La Grande, OR 97850
Estimated Value: $64,000 - $91,677
1
Bed
1
Bath
460
Sq Ft
$169/Sq Ft
Est. Value
About This Home
This home is located at 1810 N Spruce St, La Grande, OR 97850 and is currently estimated at $77,839, approximately $169 per square foot. 1810 N Spruce St is a home located in Union County with nearby schools including La Grande High School, The Marian Academy, and Grande Ronde Academy.
Ownership History
Date
Name
Owned For
Owner Type
Purchase Details
Closed on
Feb 23, 2021
Sold by
Pennington Seth
Bought by
Schlegel Amber
Current Estimated Value
Home Financials for this Owner
Home Financials are based on the most recent Mortgage that was taken out on this home.
Original Mortgage
$75,175
Outstanding Balance
$67,847
Interest Rate
2.7%
Mortgage Type
New Conventional
Estimated Equity
$9,992
Purchase Details
Closed on
Apr 25, 2019
Sold by
Bcs Rents Llc
Bought by
Pennington Seth
Create a Home Valuation Report for This Property
The Home Valuation Report is an in-depth analysis detailing your home's value as well as a comparison with similar homes in the area
Home Values in the Area
Average Home Value in this Area
Purchase History
| Date | Buyer | Sale Price | Title Company |
|---|---|---|---|
| Schlegel Amber | $77,500 | Amerititle | |
| Pennington Seth | $65,000 | Eastern Oregon Title Inc |
Source: Public Records
Mortgage History
| Date | Status | Borrower | Loan Amount |
|---|---|---|---|
| Open | Schlegel Amber | $75,175 |
Source: Public Records
Tax History Compared to Growth
Tax History
| Year | Tax Paid | Tax Assessment Tax Assessment Total Assessment is a certain percentage of the fair market value that is determined by local assessors to be the total taxable value of land and additions on the property. | Land | Improvement |
|---|---|---|---|---|
| 2024 | $674 | $37,450 | $9,790 | $27,660 |
| 2023 | $662 | $36,360 | $9,510 | $26,850 |
| 2022 | $645 | $35,303 | $9,238 | $26,065 |
| 2021 | $628 | $34,275 | $8,701 | $25,574 |
| 2020 | $462 | $25,489 | $8,467 | $17,022 |
| 2019 | $452 | $24,747 | $8,362 | $16,385 |
| 2018 | $440 | $24,027 | $8,302 | $15,725 |
| 2017 | $428 | $23,328 | $9,583 | $13,745 |
| 2016 | $415 | $22,649 | $9,354 | $13,295 |
| 2015 | $400 | $21,990 | $9,013 | $12,977 |
| 2014 | $348 | $21,350 | $8,858 | $12,492 |
| 2013 | -- | $20,729 | $8,684 | $12,045 |
Source: Public Records
Map
Nearby Homes