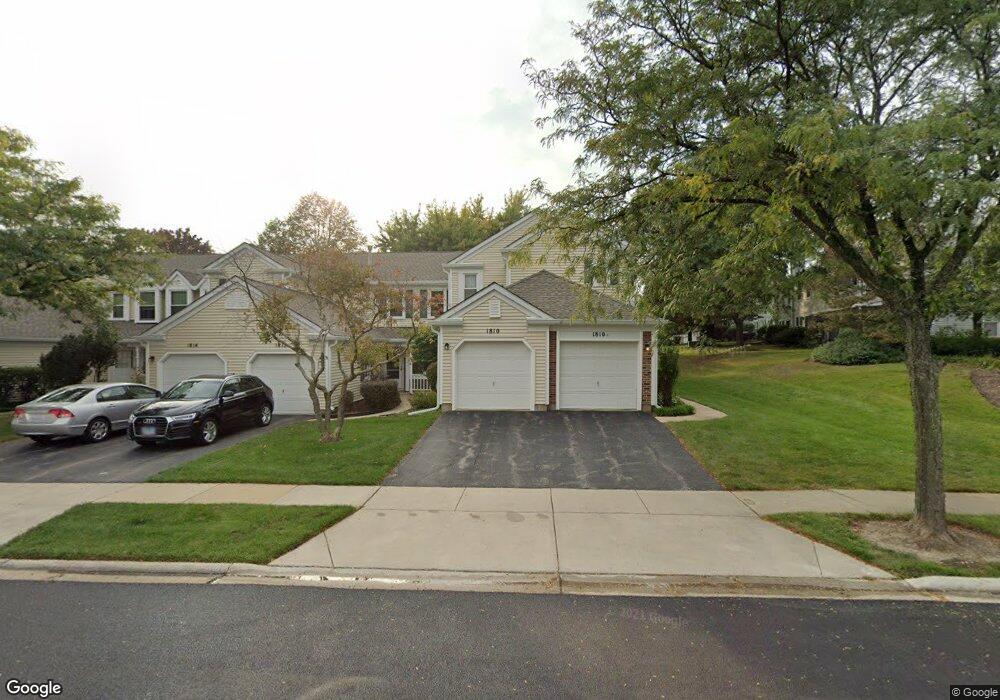
1810 Pebble Beach Cir Unit 25 Elk Grove Village, IL 60007
Elk Grove Village West NeighborhoodEstimated Value: $270,384 - $281,000
2
Beds
--
Bath
1,100
Sq Ft
$250/Sq Ft
Est. Value
About This Home
This home is located at 1810 Pebble Beach Cir Unit 25, Elk Grove Village, IL 60007 and is currently estimated at $275,346, approximately $250 per square foot. 1810 Pebble Beach Cir Unit 25 is a home located in Cook County with nearby schools including Michael Collins Elementary School, Margaret Mead Junior High School, and J B Conant High School.
Ownership History
Date
Name
Owned For
Owner Type
Purchase Details
Closed on
Jun 13, 2024
Sold by
Sureck Patricia M
Bought by
Patricia M Sureck Declaration Of Trust and Sureck
Current Estimated Value
Purchase Details
Closed on
Jun 22, 2000
Sold by
Siddiqi Rafi
Bought by
Sureck Patricia M
Home Financials for this Owner
Home Financials are based on the most recent Mortgage that was taken out on this home.
Original Mortgage
$90,000
Interest Rate
8.64%
Purchase Details
Closed on
May 7, 1994
Sold by
Siddiqi Mohammed Zainuddin
Bought by
Siddiqi Rafi
Purchase Details
Closed on
Oct 20, 1993
Sold by
Lena Frank A and Lena Kelly A
Bought by
Siddiqi Rafi and Siddiqi Mohammed Z
Home Financials for this Owner
Home Financials are based on the most recent Mortgage that was taken out on this home.
Original Mortgage
$90,000
Interest Rate
6.92%
Create a Home Valuation Report for This Property
The Home Valuation Report is an in-depth analysis detailing your home's value as well as a comparison with similar homes in the area
Home Values in the Area
Average Home Value in this Area
Purchase History
| Date | Buyer | Sale Price | Title Company |
|---|---|---|---|
| Patricia M Sureck Declaration Of Trust | -- | Attorneys Title Guaranty Fund | |
| Patricia M Sureck Declaration Of Trust | -- | Attorneys Title Guaranty Fund | |
| Sureck Patricia M | $125,000 | -- | |
| Siddiqi Rafi | -- | -- | |
| Siddiqi Rafi | $66,666 | -- |
Source: Public Records
Mortgage History
| Date | Status | Borrower | Loan Amount |
|---|---|---|---|
| Previous Owner | Sureck Patricia M | $90,000 | |
| Previous Owner | Siddiqi Rafi | $90,000 |
Source: Public Records
Tax History Compared to Growth
Tax History
| Year | Tax Paid | Tax Assessment Tax Assessment Total Assessment is a certain percentage of the fair market value that is determined by local assessors to be the total taxable value of land and additions on the property. | Land | Improvement |
|---|---|---|---|---|
| 2024 | $4,260 | $18,010 | $4,507 | $13,503 |
| 2023 | $4,108 | $18,010 | $4,507 | $13,503 |
| 2022 | $4,108 | $18,010 | $4,507 | $13,503 |
| 2021 | $3,667 | $14,927 | $5,774 | $9,153 |
| 2020 | $3,646 | $14,927 | $5,774 | $9,153 |
| 2019 | $3,648 | $16,594 | $5,774 | $10,820 |
| 2018 | $2,991 | $13,092 | $4,858 | $8,234 |
| 2017 | $2,969 | $13,092 | $4,858 | $8,234 |
| 2016 | $3,220 | $13,784 | $4,858 | $8,926 |
| 2015 | $2,346 | $10,257 | $4,225 | $6,032 |
| 2014 | $2,329 | $10,257 | $4,225 | $6,032 |
| 2013 | $2,252 | $10,257 | $4,225 | $6,032 |
Source: Public Records
Map
Nearby Homes
- 1871 Fox Run Dr Unit A
- 722 Merlin Dr Unit 16
- 263 Doral Ct Unit 1
- 307 University Ln Unit A
- 1771 Vermont Dr
- 718 N Point Dr
- 373 Southbury Ct Unit D-1
- 421 Summit Dr
- 1385 Scarboro Rd Unit 204
- 1254 Plum Tree Ct Unit A2
- 1264 Williamsburg Dr Unit D2
- 1386 Scarboro Rd Unit 1102
- 274 Buckingham Ct Unit D2
- 1910 Baltimore Dr
- 665 Arizona Pass
- 391 Thornhill Ct Unit B1
- 1257 Rosewood Ct Unit D1
- 600 Eastview Ct Unit X1
- 602 Eastview Ct Unit Z1
- 151 Brookston Dr Unit A2
- 1810 Pebble Beach Cir Unit 25
- 1810 Pebble Beach Cir Unit 1810
- 1812 Pebble Beach Cir Unit 25
- 1812 Pebble Beach Cir Unit 6
- 1814 Pebble Beach Cir Unit 25
- 1816 Pebble Beach Cir Unit 25
- 220 University Ln Unit 242
- 220 University Ln Unit 241
- 218 University Ln Unit 243
- 1818 Pebble Beach Cir Unit 25
- 216 University Ln Unit 244
- 1890 Pebble Beach Cir Unit 27
- 1890 Pebble Beach Cir Unit 27
- 1890 Pebble Beach Cir
- 1890 Pebble Beach Cir
- 1890 Pebble Beach Cir Unit A
- 1820 Pebble Beach Cir
- 1820 Pebble Beach Cir Unit 25
- 1820 Pebble Beach Cir Unit 25
- 1888 Pebble Beach Cir Unit 27