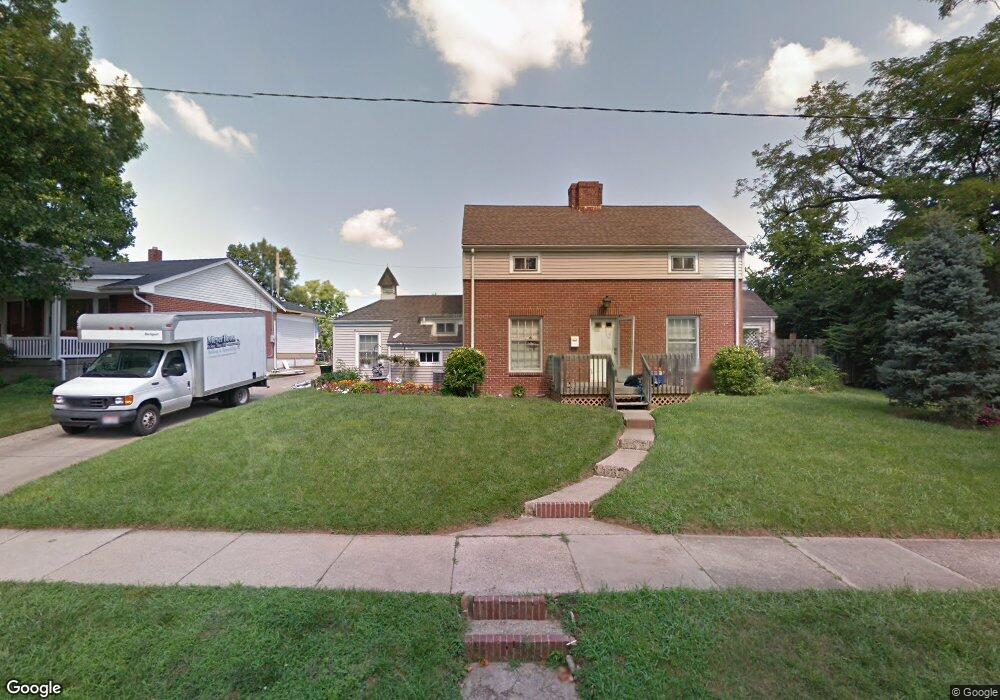
1810 S Derexa Dr Hamilton, OH 45011
East Hamilton NeighborhoodEstimated Value: $167,000 - $220,403
4
Beds
2
Baths
1,830
Sq Ft
$106/Sq Ft
Est. Value
About This Home
This home is located at 1810 S Derexa Dr, Hamilton, OH 45011 and is currently estimated at $193,351, approximately $105 per square foot. 1810 S Derexa Dr is a home located in Butler County with nearby schools including Fairwood Elementary School, Garfield Middle School, and Hamilton Freshman School.
Ownership History
Date
Name
Owned For
Owner Type
Purchase Details
Closed on
Jun 5, 2024
Sold by
Wilke Sara M and Wilke Josef H
Bought by
Dunavent Lucas K
Current Estimated Value
Home Financials for this Owner
Home Financials are based on the most recent Mortgage that was taken out on this home.
Original Mortgage
$150,000
Outstanding Balance
$147,669
Interest Rate
6.99%
Mortgage Type
New Conventional
Estimated Equity
$45,682
Purchase Details
Closed on
Jan 15, 2014
Sold by
Blevins Tricia A
Bought by
Wilke Sara M and Wilke Josef H
Purchase Details
Closed on
Jan 14, 2014
Sold by
Withrow Carolane M
Bought by
Wilke Sara M and Wilke Josef H
Purchase Details
Closed on
Sep 19, 2013
Sold by
Withrow Michael A
Bought by
Wilke Sara M and Wilke Josef H
Purchase Details
Closed on
Sep 17, 2013
Sold by
Schiering Ricki M
Bought by
Wilke Sara M and Wilke Josef H
Create a Home Valuation Report for This Property
The Home Valuation Report is an in-depth analysis detailing your home's value as well as a comparison with similar homes in the area
Home Values in the Area
Average Home Value in this Area
Purchase History
| Date | Buyer | Sale Price | Title Company |
|---|---|---|---|
| Dunavent Lucas K | $250,000 | None Listed On Document | |
| Dunavent Lucas K | $250,000 | None Listed On Document | |
| Wilke Sara M | -- | None Available | |
| Wilke Sara M | $3,000 | None Available | |
| Wilke Sara M | $3,000 | None Available | |
| Wilke Sara M | $5,000 | None Available | |
| Wilke Sara M | $5,000 | None Available | |
| Wilke Sara M | -- | None Available |
Source: Public Records
Mortgage History
| Date | Status | Borrower | Loan Amount |
|---|---|---|---|
| Open | Dunavent Lucas K | $150,000 | |
| Closed | Dunavent Lucas K | $150,000 |
Source: Public Records
Tax History
| Year | Tax Paid | Tax Assessment Tax Assessment Total Assessment is a certain percentage of the fair market value that is determined by local assessors to be the total taxable value of land and additions on the property. | Land | Improvement |
|---|---|---|---|---|
| 2025 | $2,163 | $50,990 | $7,150 | $43,840 |
| 2024 | $2,163 | $50,990 | $7,150 | $43,840 |
| 2023 | $2,143 | $50,990 | $7,150 | $43,840 |
| 2022 | $1,959 | $37,310 | $7,150 | $30,160 |
| 2021 | $1,633 | $36,040 | $7,150 | $28,890 |
| 2020 | $1,701 | $36,040 | $7,150 | $28,890 |
| 2019 | $2,493 | $34,050 | $7,040 | $27,010 |
| 2018 | $1,584 | $34,050 | $7,040 | $27,010 |
| 2017 | $1,598 | $34,050 | $7,040 | $27,010 |
| 2016 | $1,553 | $31,550 | $7,040 | $24,510 |
| 2015 | $1,545 | $31,550 | $7,040 | $24,510 |
| 2014 | $1,489 | $31,550 | $7,040 | $24,510 |
| 2013 | $1,489 | $31,510 | $6,500 | $25,010 |
Source: Public Records
Map
Nearby Homes
- 1725 Campbell Dr
- 1798 Fairgrove Ave
- 6047 Allison Ave
- 325 N Fair Ave
- 1161 Heaton St
- 922 Vine St
- 319 N 11th St
- 2795 Ashton Cir
- 446 N 6th St
- 518 Vine St
- 510 Vine St
- 1303 Campbell Ave
- 820 Dayton St
- 75 N Fair Ave
- 3883 Piper Ln
- 0 Walden Ponds Cir Unit 1867106
- 1981 Princeton Rd
- 36 N 7th St
- 431 N 3rd St
- 6278 Greens Way
- 1806 S Derexa Dr
- 1800 S Derexa Dr
- 1814 S Derexa Dr
- 1750 S Derexa Dr
- 1818 S Derexa Dr
- 1801 S Derexa Dr
- 1815 S Derexa Dr
- 1822 S Derexa Dr
- 1746 S Derexa Dr
- 1817 S Derexa Dr
- 1826 S Derexa Dr
- 1742 S Derexa Dr
- 1751 S Derexa Dr
- 1855 S Derexa Dr
- 1826 Shirley Ave
- 1834 S Derexa Dr
- 1830 Shirley Ave
- 1840 Shirley Ave
- 1740 S Derexa Dr
- 824 Elaine Ave
Your Personal Tour Guide
Ask me questions while you tour the home.