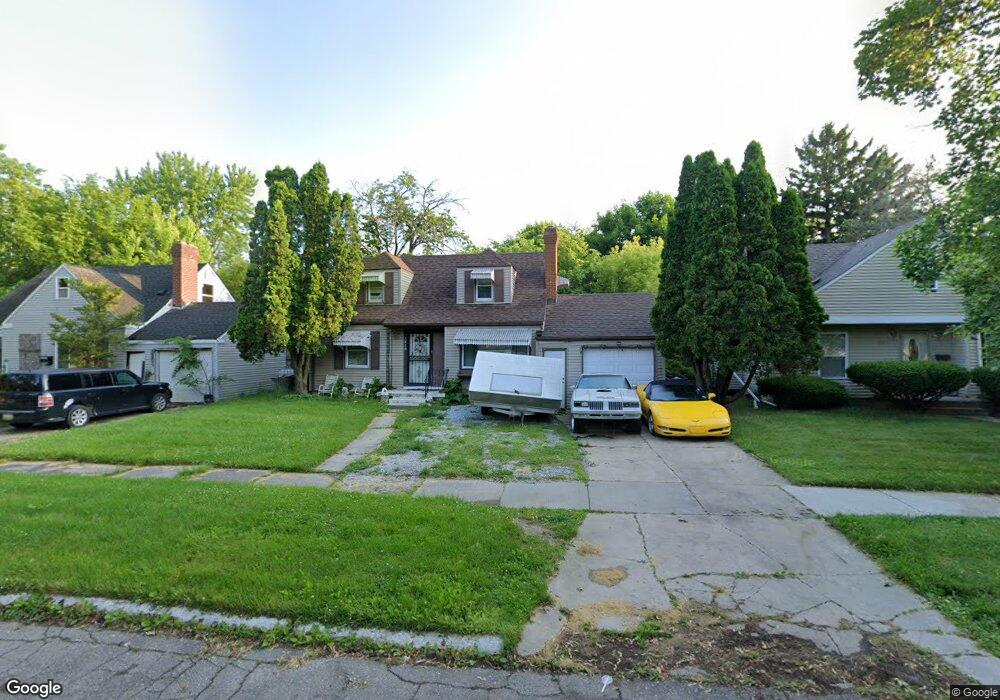
1810 W Genesee St Flint, MI 48504
Civic Park NeighborhoodEstimated Value: $50,000 - $62,000
3
Beds
2
Baths
1,285
Sq Ft
$44/Sq Ft
Est. Value
About This Home
This home is located at 1810 W Genesee St, Flint, MI 48504 and is currently estimated at $56,155, approximately $43 per square foot. 1810 W Genesee St is a home located in Genesee County with nearby schools including Brownell STEM Academy, Greater Heights Academy, and Eagle's Nest Academy.
Ownership History
Date
Name
Owned For
Owner Type
Purchase Details
Closed on
Feb 12, 2025
Sold by
Johnson Nikita
Bought by
Williams Larenda
Current Estimated Value
Purchase Details
Closed on
Nov 15, 2023
Sold by
Cobleigh Michael A
Bought by
Johnson Nakita
Purchase Details
Closed on
Mar 10, 2018
Sold by
Cobleigh Michael A
Bought by
Johnson Nikita
Purchase Details
Closed on
Nov 20, 2013
Sold by
Genesee County Treasurer
Bought by
Cobleigh Michael Ann
Purchase Details
Closed on
Dec 12, 2012
Sold by
Bailey Michael
Bought by
Residential Group 115 Llc
Purchase Details
Closed on
Nov 19, 2007
Sold by
Hicks Kathy and Hobbs Keith
Bought by
Bailey Michael Jay
Purchase Details
Closed on
Feb 1, 2006
Sold by
Galloway Ollie and Republic Bank
Bought by
Hobbs Dr Keith and Baker Joe
Create a Home Valuation Report for This Property
The Home Valuation Report is an in-depth analysis detailing your home's value as well as a comparison with similar homes in the area
Home Values in the Area
Average Home Value in this Area
Purchase History
| Date | Buyer | Sale Price | Title Company |
|---|---|---|---|
| Williams Larenda | -- | None Listed On Document | |
| Johnson Nakita | $3,200 | None Listed On Document | |
| Johnson Nikita | -- | None Available | |
| Cobleigh Michael Ann | $1,600 | None Available | |
| Residential Group 115 Llc | $21,313 | None Available | |
| Bailey Michael Jay | $72,000 | Wolverine State Title | |
| Hobbs Dr Keith | $10,737 | None Available |
Source: Public Records
Tax History Compared to Growth
Tax History
| Year | Tax Paid | Tax Assessment Tax Assessment Total Assessment is a certain percentage of the fair market value that is determined by local assessors to be the total taxable value of land and additions on the property. | Land | Improvement |
|---|---|---|---|---|
| 2025 | $1,173 | $22,300 | $0 | $0 |
| 2024 | $1,086 | $19,900 | $0 | $0 |
| 2023 | $1,060 | $14,700 | $0 | $0 |
| 2022 | $0 | $11,600 | $0 | $0 |
| 2021 | $1,075 | $12,400 | $0 | $0 |
| 2020 | $989 | $11,000 | $0 | $0 |
| 2019 | $1,068 | $12,400 | $0 | $0 |
| 2018 | $1,129 | $13,000 | $0 | $0 |
| 2017 | $1,149 | $0 | $0 | $0 |
| 2016 | $1,140 | $0 | $0 | $0 |
| 2015 | -- | $0 | $0 | $0 |
| 2014 | -- | $0 | $0 | $0 |
| 2012 | -- | $18,000 | $0 | $0 |
Source: Public Records
Map
Nearby Homes
- 1713 W Dartmouth St
- 2907 Trumbull Ave
- 2631 Brownell Blvd
- 1521 W Dartmouth St
- 2615 Trumbull Ave
- 1402 W Dartmouth St
- 1705 W Pasadena Ave
- 3412 Comstock Ave
- 2214 Mack Ave
- 1209 W Mcclellan St
- 3420 Fleming Rd
- 2407 Kellar Ave
- 2414 Delmar St
- 3617 Kellar Ave
- 3002 Proctor St
- 1101 W Rankin St
- 2331 Welch Blvd
- 2318 Delmar St
- 3819 Brownell Blvd
- 3002 N Chevrolet Ave
- 1814 W Genesee St
- 1806 W Genesee St
- 1805 W Mcclellan St
- 1818 W Genesee St
- 1809 W Mcclellan St
- 1710 W Genesee St
- 1801 W Mcclellan St
- 1813 W Mcclellan St
- 1822 W Genesee St
- 1813 W Genesee St
- 1807 W Genesee St
- 1713 W Mcclellan St
- 1817 W Mcclellan St
- 1817 W Genesee St
- 1801 W Genesee St
- 1821 W Genesee St
- 1711 W Genesee St
- 1702 W Genesee St
- 1902 W Genesee St
- 3001 Trumbull Ave