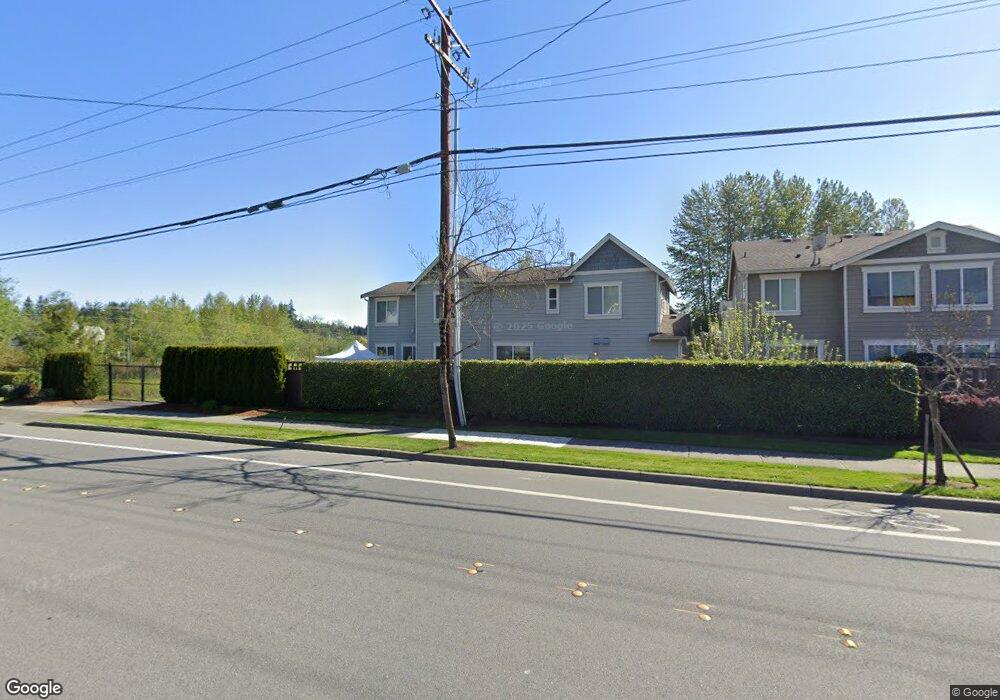
18106 35th Dr SE Unit 3 Bothell, WA 98012
North Creek NeighborhoodEstimated Value: $914,000 - $1,103,000
4
Beds
3
Baths
2,360
Sq Ft
$435/Sq Ft
Est. Value
About This Home
This home is located at 18106 35th Dr SE Unit 3, Bothell, WA 98012 and is currently estimated at $1,027,729, approximately $435 per square foot. 18106 35th Dr SE Unit 3 is a home located in Snohomish County with nearby schools including Ruby Bridges Elementary School, Skyview Middle School, and North Creek High School.
Ownership History
Date
Name
Owned For
Owner Type
Purchase Details
Closed on
Oct 3, 2012
Sold by
Henry Marie
Bought by
Henry Antonios Y
Current Estimated Value
Home Financials for this Owner
Home Financials are based on the most recent Mortgage that was taken out on this home.
Original Mortgage
$266,250
Outstanding Balance
$181,454
Interest Rate
3.63%
Mortgage Type
New Conventional
Estimated Equity
$846,275
Purchase Details
Closed on
Oct 6, 2010
Sold by
Chin Jimmy
Bought by
Henry Antonios Y
Home Financials for this Owner
Home Financials are based on the most recent Mortgage that was taken out on this home.
Original Mortgage
$232,000
Interest Rate
4.26%
Mortgage Type
New Conventional
Purchase Details
Closed on
Nov 9, 2006
Sold by
Camwest Tambark Llc
Bought by
Chin Jimmy
Home Financials for this Owner
Home Financials are based on the most recent Mortgage that was taken out on this home.
Original Mortgage
$336,760
Interest Rate
5.87%
Mortgage Type
Unknown
Create a Home Valuation Report for This Property
The Home Valuation Report is an in-depth analysis detailing your home's value as well as a comparison with similar homes in the area
Home Values in the Area
Average Home Value in this Area
Purchase History
| Date | Buyer | Sale Price | Title Company |
|---|---|---|---|
| Henry Antonios Y | -- | First American | |
| Henry Antonios Y | $290,000 | Ticor Title | |
| Chin Jimmy | $420,950 | Transnation Title |
Source: Public Records
Mortgage History
| Date | Status | Borrower | Loan Amount |
|---|---|---|---|
| Open | Henry Antonios Y | $266,250 | |
| Closed | Henry Antonios Y | $232,000 | |
| Previous Owner | Chin Jimmy | $336,760 |
Source: Public Records
Tax History
| Year | Tax Paid | Tax Assessment Tax Assessment Total Assessment is a certain percentage of the fair market value that is determined by local assessors to be the total taxable value of land and additions on the property. | Land | Improvement |
|---|---|---|---|---|
| 2026 | $8,406 | $1,009,400 | $677,200 | $332,200 |
| 2025 | $7,793 | $955,400 | $589,900 | $365,500 |
| 2024 | $7,793 | $885,800 | $533,000 | $352,800 |
| 2023 | $8,087 | $1,026,400 | $625,300 | $401,100 |
| 2022 | $6,899 | $694,600 | $350,100 | $344,500 |
| 2020 | $6,268 | $595,500 | $302,900 | $292,600 |
| 2019 | $5,782 | $556,300 | $263,200 | $293,100 |
| 2018 | $5,363 | $480,400 | $218,800 | $261,600 |
| 2017 | $4,524 | $412,900 | $168,400 | $244,500 |
| 2016 | $4,524 | $394,100 | $142,800 | $251,300 |
| 2015 | $4,514 | $373,700 | $126,600 | $247,100 |
| 2013 | $3,946 | $290,300 | $92,800 | $197,500 |
Source: Public Records
Map
Nearby Homes
- 18115 34th Dr SE
- 18223 31st Ave SE
- 3205 179th Place SE
- 3028 183rd Place SE
- 17913 38th Dr SE Unit 20
- 3414 176th Place SE
- 18725 35th Dr SE
- 18214 41st Ave SE
- 3933 178th Place SE
- 3918 177th St SE
- 18501 28th Ave SE
- 17817 41st Dr SE
- 3413 189th Place SE
- 4117 177th Place SE
- 18632 29th Ave SE
- 18309 26th Dr SE
- 4319 186th Place SE
- 4329 186th Place SE
- 17321 40th Ave SE
- 3621 192nd St SE Unit C
- 18114 35th Dr SE
- 18110 35th Dr SE
- 3523 181st Place SE Unit 1
- 18107 35th Dr SE
- 18112 36th Ave SE Unit 8
- 18116 36th Ave SE
- 18119 34th Dr SE
- 18109 36th Ave SE Unit 6
- 18123 34th Dr SE
- 18111 34th Dr SE
- 18126 35th Dr SE Unit 11
- 18115 36th Ave SE Unit 7
- 18127 34th Dr SE
- 18107 34th Dr SE
- 18128 36th Ave SE Unit 10
- 18103 34th Dr SE
- 18130 35th Dr SE
- 18132 35th Dr SE
- 3430 181st Place SE
- 18202 36th Ave SE Unit 14
Your Personal Tour Guide
Ask me questions while you tour the home.