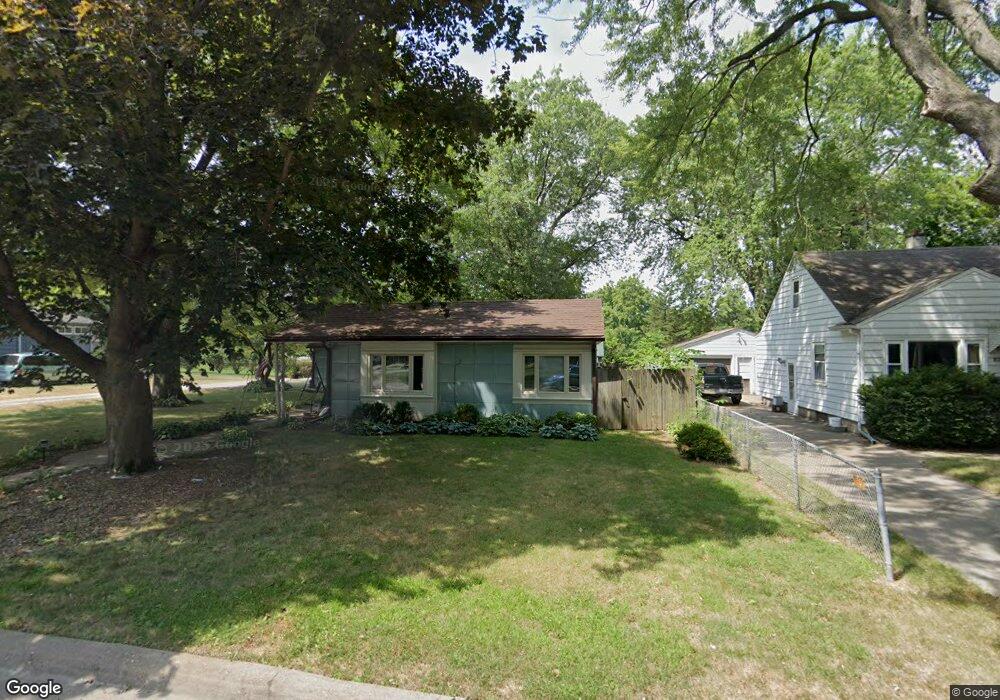
1811 35th St Moline, IL 61265
Molette NeighborhoodEstimated Value: $123,603 - $171,000
2
Beds
1
Bath
1,013
Sq Ft
$142/Sq Ft
Est. Value
About This Home
This home is located at 1811 35th St, Moline, IL 61265 and is currently estimated at $143,901, approximately $142 per square foot. 1811 35th St is a home located in Rock Island County with nearby schools including Roosevelt Elementary School, Woodrow Wilson Middle School, and Moline Sr High School.
Ownership History
Date
Name
Owned For
Owner Type
Purchase Details
Closed on
Aug 19, 2020
Sold by
Hodson Sharon K
Bought by
Mahieu Cindy and Hodson Tim
Current Estimated Value
Purchase Details
Closed on
Jul 25, 2019
Sold by
Hodson Sharon K and Hodson Peter L
Bought by
Sharon K Hodson Trust
Purchase Details
Closed on
Jun 22, 2018
Sold by
Mahieu Martin A and Mahieu Cynthia L
Bought by
Hodson Sharon K
Home Financials for this Owner
Home Financials are based on the most recent Mortgage that was taken out on this home.
Original Mortgage
$60,000
Interest Rate
6.25%
Mortgage Type
Credit Line Revolving
Purchase Details
Closed on
Jun 7, 2018
Sold by
Mahieu Martin A and Mahieu Cindy L
Bought by
Hodson Sharon K
Home Financials for this Owner
Home Financials are based on the most recent Mortgage that was taken out on this home.
Original Mortgage
$60,000
Interest Rate
6.25%
Mortgage Type
Credit Line Revolving
Purchase Details
Closed on
Jul 26, 2017
Sold by
Hodson Sharon K
Bought by
Mahieu Martin A and Mahieu Cynthia L
Create a Home Valuation Report for This Property
The Home Valuation Report is an in-depth analysis detailing your home's value as well as a comparison with similar homes in the area
Home Values in the Area
Average Home Value in this Area
Purchase History
| Date | Buyer | Sale Price | Title Company |
|---|---|---|---|
| Mahieu Cindy | -- | Breedlove Legal | |
| Sharon K Hodson Trust | -- | Wessels & Wierman Pc | |
| Hodson Sharon K | -- | Mason And Scott Pc | |
| Hodson Sharon K | -- | Wessels & Wierman Pc | |
| Mahieu Martin A | -- | Mason & Scott Pc |
Source: Public Records
Mortgage History
| Date | Status | Borrower | Loan Amount |
|---|---|---|---|
| Previous Owner | Hodson Sharon K | $60,000 | |
| Previous Owner | Hodson Sharon K | $60,000 |
Source: Public Records
Tax History
| Year | Tax Paid | Tax Assessment Tax Assessment Total Assessment is a certain percentage of the fair market value that is determined by local assessors to be the total taxable value of land and additions on the property. | Land | Improvement |
|---|---|---|---|---|
| 2024 | $2,305 | $40,646 | $4,498 | $36,148 |
| 2023 | $2,305 | $37,427 | $4,142 | $33,285 |
| 2022 | $2,174 | $35,214 | $3,897 | $31,317 |
| 2021 | $2,121 | $33,666 | $3,726 | $29,940 |
| 2020 | $2,092 | $33,104 | $3,664 | $29,440 |
| 2019 | $2,058 | $32,582 | $3,606 | $28,976 |
| 2018 | $2,212 | $32,092 | $3,552 | $28,540 |
| 2017 | $2,410 | $31,587 | $3,496 | $28,091 |
| 2016 | $2,331 | $30,608 | $3,388 | $27,220 |
| 2015 | $2,183 | $29,043 | $3,215 | $25,828 |
| 2014 | -- | $29,333 | $3,247 | $26,086 |
| 2013 | -- | $29,333 | $3,247 | $26,086 |
Source: Public Records
Map
Nearby Homes
- 3618 15th Avenue Ct
- 3610 19th Ave
- 1917 33rd St
- 3602 14th Ave
- 3316 Avenue of the Cities
- 1916 31st Street A
- 1930 31st Street A
- 2350 31st St
- 1904 30th St
- 1144 39th St
- 2423 32nd St
- 2417 31st St
- 2375 31st St Unit A
- 1501 43rd St
- 4200 13th Ave
- 4204 13th Ave
- 4216 13th Ave
- 2610 38th St Unit 1
- 2125 44th St
- 2545 18th Avenue A
Your Personal Tour Guide
Ask me questions while you tour the home.