Estimated Value: $85,000 - $134,000
2
Beds
2
Baths
1,200
Sq Ft
$91/Sq Ft
Est. Value
About This Home
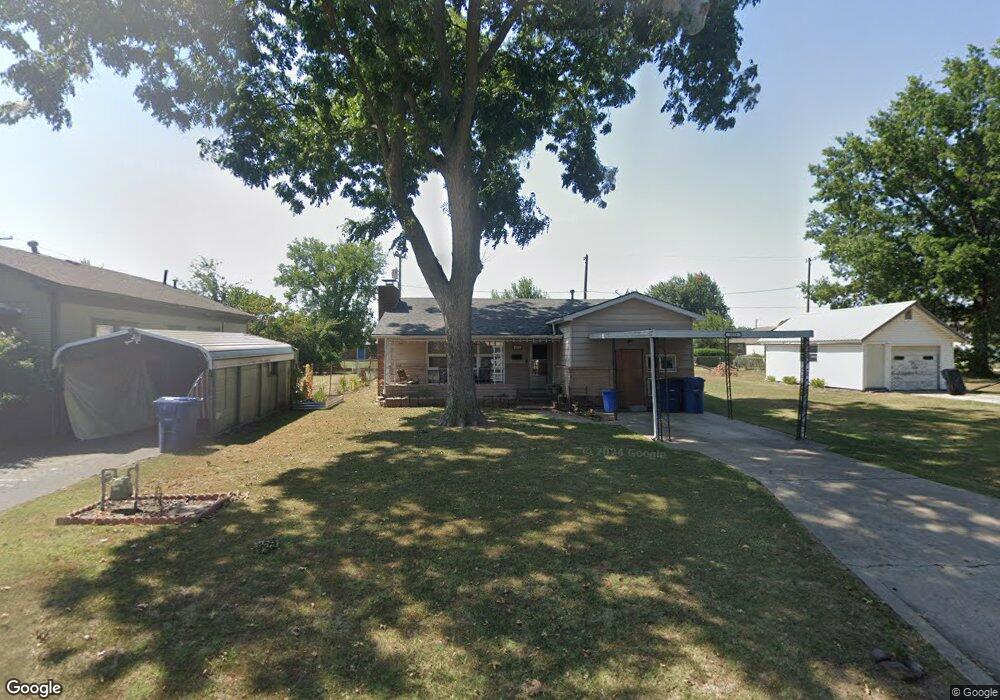
This home is located at 1811 B St NE, Miami, OK 74354 and is currently estimated at $109,240, approximately $91 per square foot. 1811 B St NE is a home located in Ottawa County with nearby schools including Miami High School and Mt. Olive Lutheran School.
Ownership History
Date
Name
Owned For
Owner Type
Purchase Details
Closed on
Feb 6, 2017
Sold by
Berry Justin Michael
Bought by
Berry Corissa D
Current Estimated Value
Purchase Details
Closed on
Feb 1, 2013
Sold by
Davis Gary Dee and Davis Melvin Lynn
Bought by
Berry Justin Michael and Lawson Corissa D
Home Financials for this Owner
Home Financials are based on the most recent Mortgage that was taken out on this home.
Original Mortgage
$41,729
Outstanding Balance
$29,082
Interest Rate
3.42%
Mortgage Type
FHA
Estimated Equity
$80,158
Create a Home Valuation Report for This Property
The Home Valuation Report is an in-depth analysis detailing your home's value as well as a comparison with similar homes in the area
Home Values in the Area
Average Home Value in this Area
Purchase History
| Date | Buyer | Sale Price | Title Company |
|---|---|---|---|
| Berry Corissa D | -- | Ottawa County Abstract & Tit | |
| Berry Justin Michael | $42,500 | Ottawa County Abstract & Tit |
Source: Public Records
Mortgage History
| Date | Status | Borrower | Loan Amount |
|---|---|---|---|
| Open | Berry Justin Michael | $41,729 |
Source: Public Records
Tax History Compared to Growth
Tax History
| Year | Tax Paid | Tax Assessment Tax Assessment Total Assessment is a certain percentage of the fair market value that is determined by local assessors to be the total taxable value of land and additions on the property. | Land | Improvement |
|---|---|---|---|---|
| 2025 | $513 | $6,267 | $570 | $5,697 |
| 2024 | $513 | $6,321 | $519 | $5,802 |
| 2023 | $513 | $6,137 | $503 | $5,634 |
| 2022 | $458 | $5,959 | $492 | $5,467 |
| 2021 | $452 | $5,785 | $481 | $5,304 |
| 2020 | $440 | $5,617 | $470 | $5,147 |
| 2019 | $366 | $5,453 | $421 | $5,032 |
| 2018 | $355 | $5,294 | $397 | $4,897 |
| 2017 | $348 | $5,140 | $374 | $4,766 |
| 2016 | $321 | $4,990 | $352 | $4,638 |
| 2015 | $244 | $2,749 | $398 | $2,351 |
| 2014 | $315 | $4,845 | $342 | $4,503 |
Source: Public Records
Map
Nearby Homes