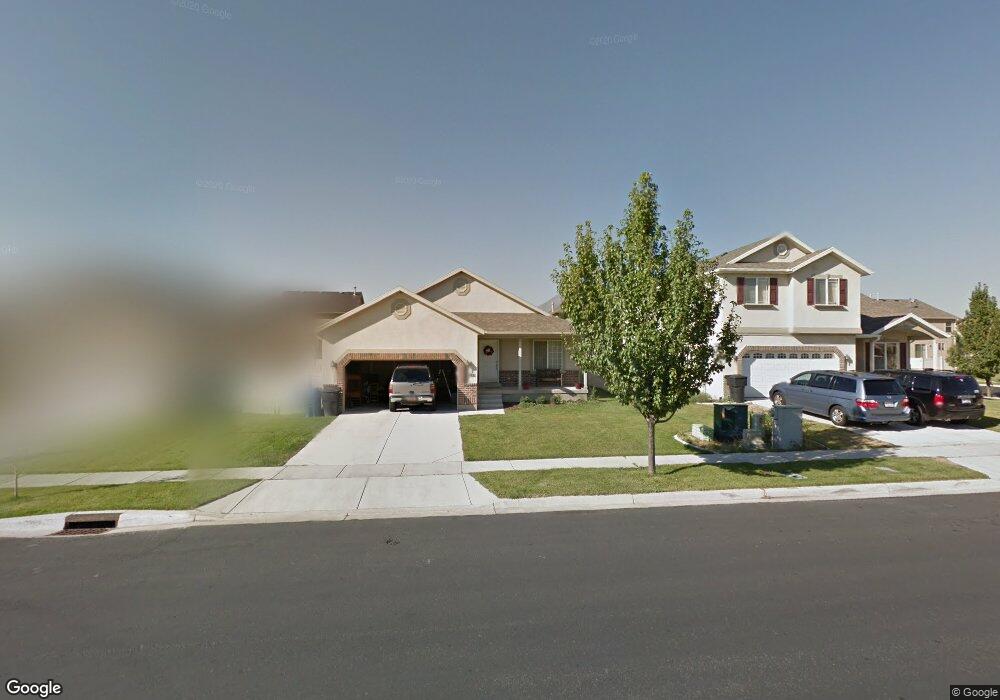
1811 E 1130 S Spanish Fork, UT 84660
Estimated Value: $517,000 - $580,000
3
Beds
2
Baths
2,669
Sq Ft
$203/Sq Ft
Est. Value
About This Home
This home is located at 1811 E 1130 S, Spanish Fork, UT 84660 and is currently estimated at $541,440, approximately $202 per square foot. 1811 E 1130 S is a home located in Utah County with nearby schools including East Meadows Elementary School, Spanish Fork Jr High School, and Spanish Fork High School.
Ownership History
Date
Name
Owned For
Owner Type
Purchase Details
Closed on
Jun 4, 2019
Sold by
Cabreros Ellison I and Cabreros Kelly D
Bought by
Cabreros Kelly K and Cabreros Ellison I
Current Estimated Value
Home Financials for this Owner
Home Financials are based on the most recent Mortgage that was taken out on this home.
Original Mortgage
$279,125
Outstanding Balance
$243,884
Interest Rate
4.2%
Mortgage Type
FHA
Estimated Equity
$297,556
Purchase Details
Closed on
Jun 20, 2005
Sold by
Tuscany Homes Llc
Bought by
Cabreros Ellison I and Cabreros Kelly D
Home Financials for this Owner
Home Financials are based on the most recent Mortgage that was taken out on this home.
Original Mortgage
$34,680
Interest Rate
5.58%
Mortgage Type
Stand Alone Second
Create a Home Valuation Report for This Property
The Home Valuation Report is an in-depth analysis detailing your home's value as well as a comparison with similar homes in the area
Home Values in the Area
Average Home Value in this Area
Purchase History
| Date | Buyer | Sale Price | Title Company |
|---|---|---|---|
| Cabreros Kelly K | -- | Key Land Title | |
| Cabreros Ellison I | -- | Merrill Title Company |
Source: Public Records
Mortgage History
| Date | Status | Borrower | Loan Amount |
|---|---|---|---|
| Open | Cabreros Kelly K | $279,125 | |
| Closed | Cabreros Ellison I | $34,680 | |
| Closed | Cabreros Ellison I | $138,719 |
Source: Public Records
Tax History
| Year | Tax Paid | Tax Assessment Tax Assessment Total Assessment is a certain percentage of the fair market value that is determined by local assessors to be the total taxable value of land and additions on the property. | Land | Improvement |
|---|---|---|---|---|
| 2025 | $2,401 | $266,145 | -- | -- |
| 2024 | $2,401 | $247,445 | $0 | $0 |
| 2023 | $2,468 | $254,705 | $0 | $0 |
| 2022 | $2,446 | $247,500 | $0 | $0 |
| 2021 | $2,107 | $341,200 | $105,200 | $236,000 |
| 2020 | $1,995 | $314,100 | $95,600 | $218,500 |
| 2019 | $1,790 | $296,400 | $79,700 | $216,700 |
| 2018 | $1,681 | $269,100 | $75,200 | $193,900 |
| 2017 | $1,551 | $133,430 | $0 | $0 |
| 2016 | $1,393 | $118,305 | $0 | $0 |
| 2015 | $1,233 | $103,455 | $0 | $0 |
| 2014 | $1,091 | $91,850 | $0 | $0 |
Source: Public Records
Map
Nearby Homes
- 1878 E 1050 S
- 1166 S 1920 E
- 1692 E 1000 S
- 1147 S 1660 E
- 938 S 1740 E
- 1282 S 2000 E
- 839 S 1760 E
- 2308 E 850 South St Unit 10
- 2034 E 800 S
- 357 E 1460 S Unit 45
- 385 E 1460 S Unit 47
- 1061 S 2230 E
- 857 S 1300 E Unit 32
- 762 S 1360 E Unit 25
- 815 S 1300 E Unit 34
- 2342 E 830 S Unit 27
- 2342 E 830 S
- 2342 E 830 S Unit 26
- 834 S 1300 #16gc E
- 816 S 1300 E
Your Personal Tour Guide
Ask me questions while you tour the home.