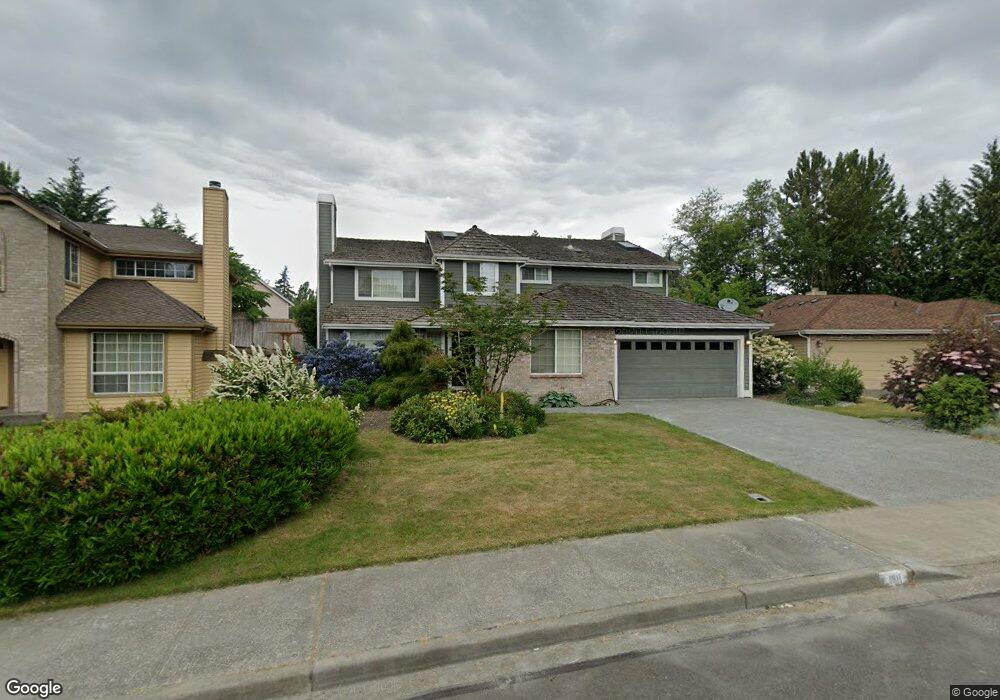
1811 Field Ave NE Renton, WA 98059
West Renton Highlands NeighborhoodEstimated Value: $1,142,101 - $1,212,000
4
Beds
3
Baths
2,710
Sq Ft
$435/Sq Ft
Est. Value
About This Home
This home is located at 1811 Field Ave NE, Renton, WA 98059 and is currently estimated at $1,179,025, approximately $435 per square foot. 1811 Field Ave NE is a home located in King County with nearby schools including Sierra Heights Elementary School, Risdon Middle School, and Hazen Senior High School.
Ownership History
Date
Name
Owned For
Owner Type
Purchase Details
Closed on
Nov 9, 2001
Sold by
Marks Scott A
Bought by
Wood Michelle Lee
Current Estimated Value
Purchase Details
Closed on
Jul 19, 1999
Sold by
Rohling Ronald F and Rohling Evelyn I
Bought by
Marks Scott A and Petersen Michelle L
Home Financials for this Owner
Home Financials are based on the most recent Mortgage that was taken out on this home.
Original Mortgage
$278,900
Interest Rate
6.5%
Purchase Details
Closed on
Jun 6, 1996
Sold by
Murphy James E and Murphy Tracy K
Bought by
Rohling Ronald F and Rohling Evelyn I
Home Financials for this Owner
Home Financials are based on the most recent Mortgage that was taken out on this home.
Original Mortgage
$187,200
Interest Rate
7.96%
Purchase Details
Closed on
Jun 29, 1993
Sold by
Murphy Jr James E and Murphy Tracy K
Bought by
Murphy James E and Murphy Tracy K
Purchase Details
Closed on
Mar 23, 1992
Sold by
Henderson Homes Inc
Bought by
Montana Tracy and Murphy James
Create a Home Valuation Report for This Property
The Home Valuation Report is an in-depth analysis detailing your home's value as well as a comparison with similar homes in the area
Home Values in the Area
Average Home Value in this Area
Purchase History
| Date | Buyer | Sale Price | Title Company |
|---|---|---|---|
| Wood Michelle Lee | $135,795 | Stewart Title | |
| Marks Scott A | $293,600 | Commonwealth Land Title Ins | |
| Rohling Ronald F | $234,000 | Stewart Title | |
| Murphy James E | -- | -- | |
| Montana Tracy | $210,700 | -- |
Source: Public Records
Mortgage History
| Date | Status | Borrower | Loan Amount |
|---|---|---|---|
| Previous Owner | Marks Scott A | $278,900 | |
| Previous Owner | Rohling Ronald F | $187,200 |
Source: Public Records
Tax History Compared to Growth
Tax History
| Year | Tax Paid | Tax Assessment Tax Assessment Total Assessment is a certain percentage of the fair market value that is determined by local assessors to be the total taxable value of land and additions on the property. | Land | Improvement |
|---|---|---|---|---|
| 2024 | $9,636 | $939,000 | $652,000 | $287,000 |
| 2023 | $9,146 | $820,000 | $572,000 | $248,000 |
| 2022 | $8,173 | $948,000 | $660,000 | $288,000 |
| 2021 | $7,479 | $729,000 | $284,000 | $445,000 |
| 2020 | $7,434 | $637,000 | $243,000 | $394,000 |
| 2018 | $7,517 | $627,000 | $237,000 | $390,000 |
| 2017 | $6,740 | $573,000 | $216,000 | $357,000 |
| 2016 | $6,239 | $502,000 | $190,000 | $312,000 |
| 2015 | $5,319 | $471,000 | $184,000 | $287,000 |
| 2014 | -- | $420,000 | $173,000 | $247,000 |
| 2013 | -- | $319,000 | $142,000 | $177,000 |
Source: Public Records
Map
Nearby Homes
- 4808 NE Sunset Blvd Unit A101
- 1613 Hoquiam Place NE
- 4509 NE 19th St
- 1734 Ilwaco Ave NE
- 2229 Ilwaco Ave NE
- 4313 NE 20th St
- 4308 NE Sunset Blvd Unit B5
- 4300 NE Sunset Blvd Unit L3
- 4300 NE Sunset Blvd Unit C6
- 4300 NE Sunset Blvd Unit D8
- 1727 Nile Ave NE
- 4325 NE Sunset Blvd
- 4413 NE 26th Ct
- 3018 Ilwaco Ave NE
- 1555 Union Ave NE Unit H54
- 1615 Redmond Ct NE
- 959 Hoquiam Ave NE
- 1103 Vashon Ct NE
- 3821 NE 14th Place
- 5120 NE 9th Place
- 1807 Field Ave NE
- 1800 Elma Ave NE
- 1815 Field Ave NE
- 1806 Elma Ave NE
- 1812 Elma Ave NE
- 1803 Field Ave NE
- 1839 Field Place NE
- 4805 NE 18th St
- 1903 Field Ave NE
- 4717 NE 18th St
- 1833 Field Place NE
- 1820 Elma Ave NE
- 1802 Field Ave NE
- 1717 Field Ave NE
- 4711 NE 18th St
- 1902 Field Ave NE
- 1824 Elma Ave NE
- 1817 Field Place NE
- 1805 Elma Ave NE
- 4905 NE 19th Ct