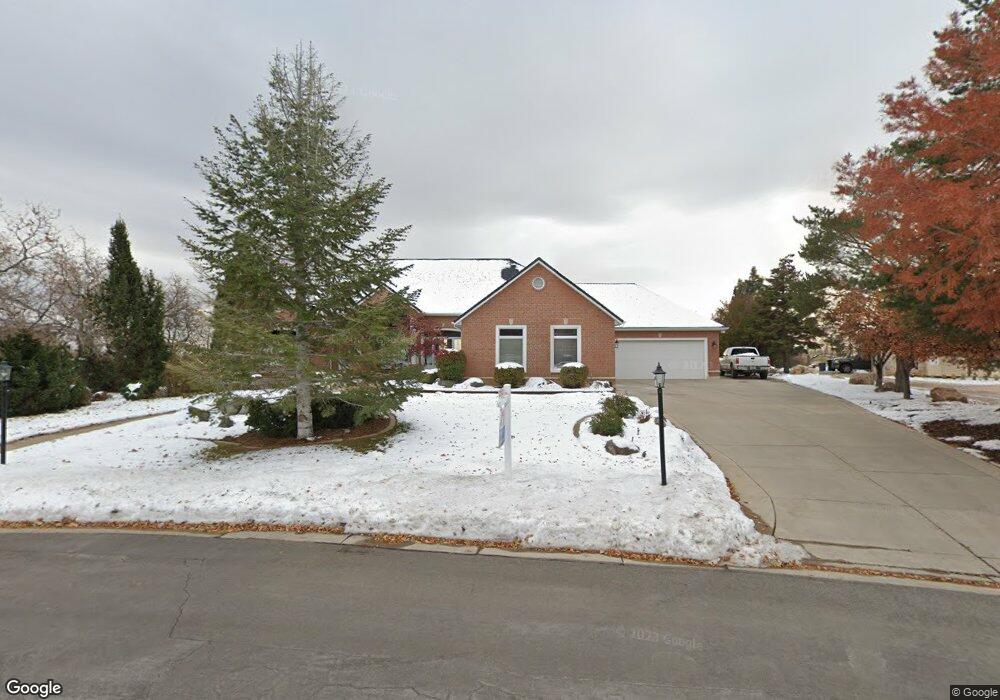
1811 Forest Ridge Dr Unit 11 Layton, UT 84040
Estimated Value: $991,000 - $1,396,017
6
Beds
6
Baths
7,325
Sq Ft
$164/Sq Ft
Est. Value
About This Home
This home is located at 1811 Forest Ridge Dr Unit 11, Layton, UT 84040 and is currently estimated at $1,201,004, approximately $163 per square foot. 1811 Forest Ridge Dr Unit 11 is a home located in Davis County with nearby schools including Sarah Jane Adams Elementary School, North Layton Junior High School, and Northridge High School.
Ownership History
Date
Name
Owned For
Owner Type
Purchase Details
Closed on
Mar 24, 2023
Sold by
Austin Family Trust
Bought by
Broadbent Daniel and Broadbent Tera
Current Estimated Value
Home Financials for this Owner
Home Financials are based on the most recent Mortgage that was taken out on this home.
Original Mortgage
$852,411
Outstanding Balance
$825,602
Interest Rate
6.12%
Mortgage Type
New Conventional
Estimated Equity
$375,402
Purchase Details
Closed on
Jul 12, 2012
Sold by
Austin Blaine D and Austin Diane S
Bought by
Austin Blaine D and Austin Diane S
Purchase Details
Closed on
Oct 25, 2002
Sold by
Austin Blaine D and Austin Diane
Bought by
Austin Blaine D and Austin Diane S
Home Financials for this Owner
Home Financials are based on the most recent Mortgage that was taken out on this home.
Original Mortgage
$300,700
Interest Rate
5.99%
Purchase Details
Closed on
Dec 3, 1999
Sold by
Lyon David G
Bought by
Layton David G and The David G Lyon Living Trust
Create a Home Valuation Report for This Property
The Home Valuation Report is an in-depth analysis detailing your home's value as well as a comparison with similar homes in the area
Home Values in the Area
Average Home Value in this Area
Purchase History
| Date | Buyer | Sale Price | Title Company |
|---|---|---|---|
| Broadbent Daniel | -- | Old Republic Title | |
| Austin Blaine D | -- | None Available | |
| Austin Blaine D | -- | Equity Title Agency | |
| Layton David G | -- | -- |
Source: Public Records
Mortgage History
| Date | Status | Borrower | Loan Amount |
|---|---|---|---|
| Open | Broadbent Daniel | $852,411 | |
| Previous Owner | Austin Blaine D | $300,700 |
Source: Public Records
Tax History Compared to Growth
Tax History
| Year | Tax Paid | Tax Assessment Tax Assessment Total Assessment is a certain percentage of the fair market value that is determined by local assessors to be the total taxable value of land and additions on the property. | Land | Improvement |
|---|---|---|---|---|
| 2025 | $7,465 | $719,955 | $315,380 | $404,575 |
| 2024 | $7,058 | $691,520 | $311,042 | $380,478 |
| 2023 | $6,248 | $1,050,000 | $335,043 | $714,957 |
| 2022 | $6,844 | $634,700 | $182,288 | $452,412 |
| 2021 | $6,068 | $836,000 | $279,463 | $556,537 |
| 2020 | $5,607 | $738,000 | $262,644 | $475,356 |
| 2019 | $5,615 | $728,000 | $229,268 | $498,732 |
| 2018 | $5,223 | $677,000 | $212,751 | $464,249 |
| 2016 | $5,067 | $355,370 | $106,085 | $249,285 |
| 2015 | $5,022 | $337,385 | $106,085 | $231,300 |
| 2014 | $4,304 | $297,058 | $106,085 | $190,973 |
| 2013 | -- | $177,541 | $91,369 | $86,172 |
Source: Public Records
Map
Nearby Homes
- 2011 Dan Dr
- 2411 Kays Creek Dr
- 1735 Hayes Dr
- 1975 E 1425 N
- 2316 E 1975 N
- 2141 E Oak Ln Unit 5
- 1522 N 2200 E
- 1657 E Cherry Ln
- 2273 N 1975 E
- 1463 Kays Creek Dr
- 2202 N 2300 E
- 2096 N 1450 E
- 1251 E Larkspur Way
- 2345 E Cherry Ln
- 1379 E Petunia Ct
- 1204 N 1875 E Unit 5
- Richards Plan at Eastridge Park - The Vistas
- Brynlee Plan at Eastridge Park - The Vistas
- Brynlee Plan at Eastridge Park - The Heights
- Ontario Plan at Eastridge Park - The Heights
- 1811 Forest Ridge Dr
- 1992 Forest Ridge Dr
- 1831 Forest Ridge Dr
- 1838 Forest Ridge Dr
- 1838 Forest Ridge Dr
- 1851 Forest Ridge Dr
- 2007 Forest Ridge Dr
- 2012 Forest Ridge Dr
- 1953 Dan Dr
- 1971 Dan Dr
- 1935 Dan Dr Unit 2
- 1991 Dan Dr
- 1862 Forest Ridge Dr
- 1862 Forest Ridge Dr
- 2027 Forest Ridge Dr
- 1917 Dan Dr
- 1960 E 1900 N
- 1879 Forest Ridge Dr
- 2036 Forest Ridge Dr
- 1936 E 1900 N