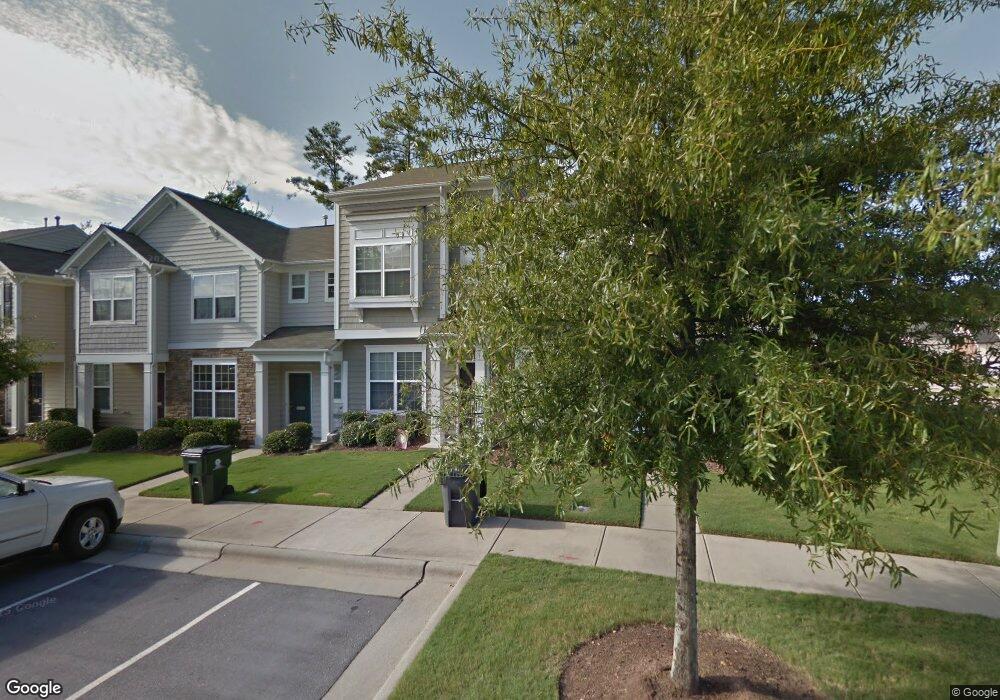
1811 Grace Point Rd Unit 50 Morrisville, NC 27560
Estimated Value: $336,000 - $364,000
2
Beds
3
Baths
1,407
Sq Ft
$248/Sq Ft
Est. Value
About This Home
This home is located at 1811 Grace Point Rd Unit 50, Morrisville, NC 27560 and is currently estimated at $349,491, approximately $248 per square foot. 1811 Grace Point Rd Unit 50 is a home located in Wake County with nearby schools including Parkside Elementary School, Alston Ridge Middle School, and Panther Creek High School.
Ownership History
Date
Name
Owned For
Owner Type
Purchase Details
Closed on
Oct 11, 2017
Sold by
Roberts Erin R
Bought by
Betzel Matthew
Current Estimated Value
Home Financials for this Owner
Home Financials are based on the most recent Mortgage that was taken out on this home.
Original Mortgage
$187,210
Outstanding Balance
$156,205
Interest Rate
3.78%
Mortgage Type
New Conventional
Estimated Equity
$193,286
Purchase Details
Closed on
Oct 29, 2013
Sold by
Covington David and Covington Sheila
Bought by
Roberts Erin R
Home Financials for this Owner
Home Financials are based on the most recent Mortgage that was taken out on this home.
Original Mortgage
$147,155
Interest Rate
4.57%
Mortgage Type
New Conventional
Purchase Details
Closed on
Sep 1, 2009
Sold by
Standard Pacific Of The Carolinas Llc
Bought by
Covington Sheila and Covington David
Home Financials for this Owner
Home Financials are based on the most recent Mortgage that was taken out on this home.
Original Mortgage
$148,622
Interest Rate
5.11%
Mortgage Type
FHA
Create a Home Valuation Report for This Property
The Home Valuation Report is an in-depth analysis detailing your home's value as well as a comparison with similar homes in the area
Home Values in the Area
Average Home Value in this Area
Purchase History
| Date | Buyer | Sale Price | Title Company |
|---|---|---|---|
| Betzel Matthew | $193,000 | None Available | |
| Roberts Erin R | $155,000 | None Available | |
| Covington Sheila | $152,000 | None Available |
Source: Public Records
Mortgage History
| Date | Status | Borrower | Loan Amount |
|---|---|---|---|
| Open | Betzel Matthew | $187,210 | |
| Previous Owner | Roberts Erin R | $147,155 | |
| Previous Owner | Covington Sheila | $148,622 |
Source: Public Records
Tax History Compared to Growth
Tax History
| Year | Tax Paid | Tax Assessment Tax Assessment Total Assessment is a certain percentage of the fair market value that is determined by local assessors to be the total taxable value of land and additions on the property. | Land | Improvement |
|---|---|---|---|---|
| 2025 | $3,181 | $361,646 | $95,000 | $266,646 |
| 2024 | $3,168 | $361,646 | $95,000 | $266,646 |
| 2023 | $2,488 | $235,730 | $63,000 | $172,730 |
| 2022 | $2,400 | $235,730 | $63,000 | $172,730 |
| 2021 | $2,296 | $235,730 | $63,000 | $172,730 |
| 2020 | $2,283 | $235,730 | $63,000 | $172,730 |
| 2019 | $1,887 | $168,091 | $42,000 | $126,091 |
| 2018 | $1,776 | $168,091 | $42,000 | $126,091 |
| 2017 | $1,709 | $168,091 | $42,000 | $126,091 |
| 2016 | $1,685 | $146,664 | $50,000 | $96,664 |
| 2015 | $1,406 | $135,260 | $36,000 | $99,260 |
| 2014 | -- | $135,260 | $36,000 | $99,260 |
Source: Public Records
Map
Nearby Homes
- 309 Colwick Ln
- 401 Stockton Gorge Rd
- 421 Hamlet Park Dr
- 101 Hamlet Park Dr
- 2032 Kirkhaven Rd
- 1135 Forest Willow Ln
- 2205 Kirkhaven Rd
- 2108 Junewood Ln
- 0 Lot 2 Church St
- 0 Lot 1 Church St
- 0 Lot 5 Church St
- 0 Lot 6 Church St
- 0 Lot 4 Church St
- 508 Durants Neck Ln
- 1025 Historic Cir
- 1404 Legendary Ln
- 204 Concordia Woods Dr
- 605 Courthouse Dr
- 142 Brentfield Loop
- 784 Newstead Way
- 1811 Grace Point Rd
- 1809 Grace Point Rd
- 1809 Grace Point Rd Unit 51
- 1813 Grace Point Rd
- 1813 Grace Point Rd Unit 49
- 1807 Grace Point Rd
- 1807 Grace Point Rd Unit 52
- 1805 Grace Point Rd
- 1805 Grace Point Rd Unit 53
- 1803 Grace Point Rd
- 1803 Grace Point Rd Unit 54
- 1801 Grace Point Rd
- 1801 Grace Point Rd Unit 55
- 1812 Grace Point Rd
- 1812 Grace Point Rd Unit 118
- 1810 Grace Point Rd
- 1810 Grace Point Rd Unit 117
- 1808 Grace Point Rd
- 1808 Grace Point Rd Unit 116
- 1806 Grace Point Rd