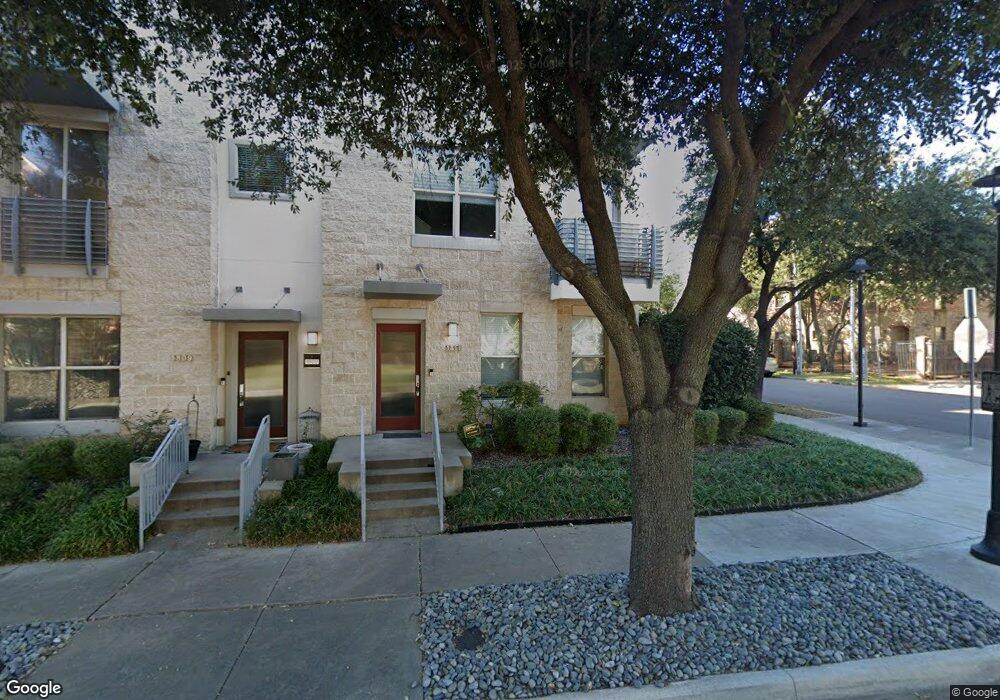
1811 Matilda St Dallas, TX 75206
Lower Greenville NeighborhoodEstimated Value: $593,000 - $709,000
2
Beds
3
Baths
2,005
Sq Ft
$321/Sq Ft
Est. Value
About This Home
This home is located at 1811 Matilda St, Dallas, TX 75206 and is currently estimated at $642,877, approximately $320 per square foot. 1811 Matilda St is a home located in Dallas County with nearby schools including J L Long Middle School, Woodrow Wilson High School, and Uplift Peak Preparatory High School.
Ownership History
Date
Name
Owned For
Owner Type
Purchase Details
Closed on
Apr 22, 2019
Sold by
Ruckdeschel Caleb A and Ruckdeschel Chelsea Darwin
Bought by
Mcmurray Ryan
Current Estimated Value
Home Financials for this Owner
Home Financials are based on the most recent Mortgage that was taken out on this home.
Original Mortgage
$392,000
Outstanding Balance
$344,638
Interest Rate
4.3%
Mortgage Type
Purchase Money Mortgage
Estimated Equity
$298,239
Purchase Details
Closed on
Jan 25, 2017
Sold by
Baumann Mark
Bought by
Rucdechel Calbee A and Rucdechel Chelsea Darwin
Home Financials for this Owner
Home Financials are based on the most recent Mortgage that was taken out on this home.
Original Mortgage
$424,000
Interest Rate
4.32%
Mortgage Type
New Conventional
Purchase Details
Closed on
Aug 17, 2007
Sold by
Rivendell Matilda Lp
Bought by
Baumann Mark
Create a Home Valuation Report for This Property
The Home Valuation Report is an in-depth analysis detailing your home's value as well as a comparison with similar homes in the area
Home Values in the Area
Average Home Value in this Area
Purchase History
| Date | Buyer | Sale Price | Title Company |
|---|---|---|---|
| Mcmurray Ryan | -- | Texas Premier Title | |
| Rucdechel Calbee A | -- | Capital Title | |
| Baumann Mark | -- | Rtt |
Source: Public Records
Mortgage History
| Date | Status | Borrower | Loan Amount |
|---|---|---|---|
| Open | Mcmurray Ryan | $392,000 | |
| Previous Owner | Rucdechel Calbee A | $424,000 |
Source: Public Records
Tax History Compared to Growth
Tax History
| Year | Tax Paid | Tax Assessment Tax Assessment Total Assessment is a certain percentage of the fair market value that is determined by local assessors to be the total taxable value of land and additions on the property. | Land | Improvement |
|---|---|---|---|---|
| 2025 | $10,012 | $582,730 | $88,200 | $494,530 |
| 2024 | $10,012 | $596,130 | $141,360 | $454,770 |
| 2023 | $10,012 | $530,170 | $106,020 | $424,150 |
| 2022 | $13,256 | $530,170 | $106,020 | $424,150 |
| 2021 | $12,535 | $475,190 | $106,020 | $369,170 |
| 2020 | $12,891 | $475,190 | $106,020 | $369,170 |
| 2019 | $13,121 | $461,150 | $70,680 | $390,470 |
| 2018 | $13,121 | $461,150 | $70,680 | $390,470 |
| 2017 | $12,376 | $455,130 | $36,400 | $418,730 |
| 2016 | $9,814 | $360,900 | $36,400 | $324,500 |
| 2015 | $6,001 | $266,660 | $29,120 | $237,540 |
| 2014 | $6,001 | $266,660 | $29,120 | $237,540 |
Source: Public Records
Map
Nearby Homes
- 5713 La Vista Dr
- 5830 La Vista Ct
- 5851 La Vista Ct
- 1909 Hope Way
- 5609 Lewis St
- 5707 Lewis St
- 5838 La Vista Dr
- 5747 Prospect Ave Unit B
- 5875 Ross Ave Unit 6
- 5828 Prospect Ave
- 2003 Summit Ave
- 1516 Hope St
- 5804 Hudson St Unit B
- 5804 Hudson St Unit A
- 1848 Euclid Ave Unit 104
- 5810 Hudson St
- 5839 Richmond Ave
- 5618 Lindell Ave Unit 7
- 5963 Ross Ave Unit 202
- 2026 Euclid Ave
- 1809 Matilda St
- 5710 La Vista Dr
- 1807 Matilda St
- 1805 Matilda St
- 5708 La Vista Dr
- 5706 La Vista Dr
- 5611 Lewis St
- 1803 Matilda St
- 5720 La Vista Dr
- 5609 Lewis St Unit 5609
- 5704 La Vista Dr
- 5607 Lewis St
- 5701 Lewis St
- 5722 La Vista Dr
- 5605 Lewis St
- 5702 La Vista Dr
- 5703 Lewis St
- 5724 La Vista Dr
- 5603 Lewis St
- 5744 La Vista Ct