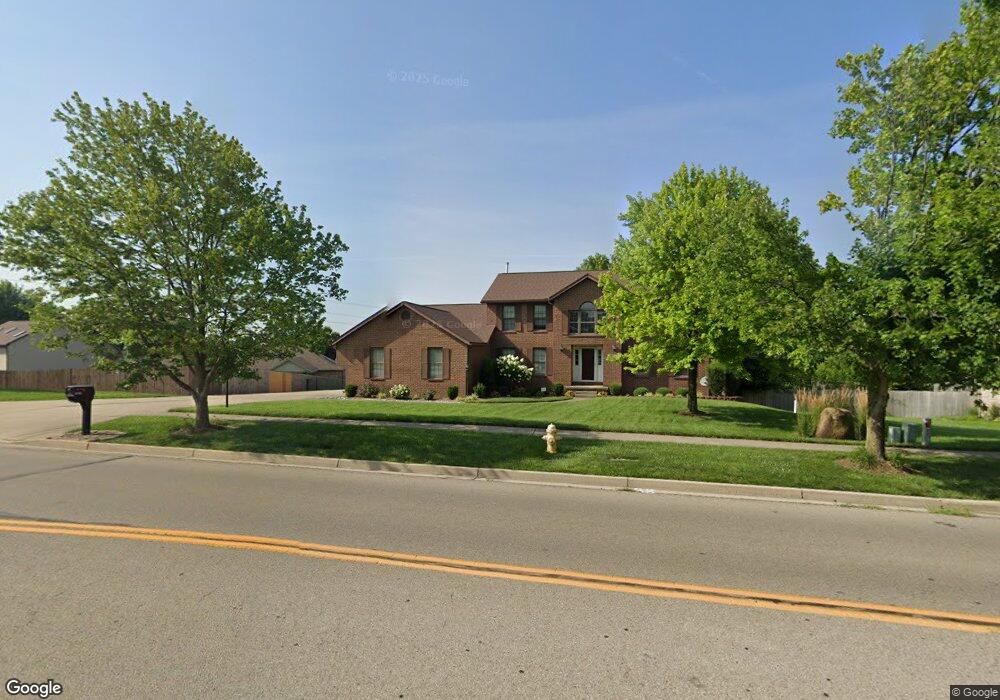
1811 Maue Rd Miamisburg, OH 45342
Estimated Value: $396,000 - $416,928
3
Beds
4
Baths
2,570
Sq Ft
$158/Sq Ft
Est. Value
About This Home
This home is located at 1811 Maue Rd, Miamisburg, OH 45342 and is currently estimated at $406,232, approximately $158 per square foot. 1811 Maue Rd is a home located in Montgomery County with nearby schools including Miamisburg High School and Bethel Baptist School.
Ownership History
Date
Name
Owned For
Owner Type
Purchase Details
Closed on
Jul 14, 2017
Sold by
Thompson Doug A and Thompson Douglas A
Bought by
Gump Brandon and Gump Lauren K
Current Estimated Value
Home Financials for this Owner
Home Financials are based on the most recent Mortgage that was taken out on this home.
Original Mortgage
$191,920
Outstanding Balance
$159,541
Interest Rate
3.91%
Mortgage Type
New Conventional
Estimated Equity
$246,691
Purchase Details
Closed on
Dec 13, 2001
Sold by
Thompson Kimberly D
Bought by
Thompson Douglas A
Purchase Details
Closed on
Jul 15, 1999
Sold by
Lipscomb Larry J and Lipscomb Margaret A
Bought by
Thompson Douglas A and Thompson Kimberly D
Home Financials for this Owner
Home Financials are based on the most recent Mortgage that was taken out on this home.
Original Mortgage
$215,900
Interest Rate
7.54%
Mortgage Type
Balloon
Purchase Details
Closed on
Jul 22, 1994
Sold by
Snelling Janice L
Bought by
Lipscomb Larry J and Lipscomb Margaret A
Create a Home Valuation Report for This Property
The Home Valuation Report is an in-depth analysis detailing your home's value as well as a comparison with similar homes in the area
Home Values in the Area
Average Home Value in this Area
Purchase History
| Date | Buyer | Sale Price | Title Company |
|---|---|---|---|
| Gump Brandon | $239,900 | Landmark Title Agency South | |
| Thompson Douglas A | -- | -- | |
| Thompson Douglas A | $239,900 | Midwest Abstract Company | |
| Lipscomb Larry J | -- | Midland Title Security Inc |
Source: Public Records
Mortgage History
| Date | Status | Borrower | Loan Amount |
|---|---|---|---|
| Open | Gump Brandon | $191,920 | |
| Previous Owner | Thompson Douglas A | $215,900 |
Source: Public Records
Tax History Compared to Growth
Tax History
| Year | Tax Paid | Tax Assessment Tax Assessment Total Assessment is a certain percentage of the fair market value that is determined by local assessors to be the total taxable value of land and additions on the property. | Land | Improvement |
|---|---|---|---|---|
| 2024 | $7,987 | $126,100 | $19,550 | $106,550 |
| 2023 | $7,987 | $126,100 | $19,550 | $106,550 |
| 2022 | $7,126 | $94,810 | $14,700 | $80,110 |
| 2021 | $6,301 | $94,810 | $14,700 | $80,110 |
| 2020 | $6,293 | $94,810 | $14,700 | $80,110 |
| 2019 | $6,815 | $94,080 | $10,500 | $83,580 |
| 2018 | $6,117 | $84,370 | $10,500 | $73,870 |
| 2017 | $6,076 | $84,370 | $10,500 | $73,870 |
| 2016 | $5,794 | $77,540 | $10,500 | $67,040 |
| 2015 | $5,680 | $77,540 | $10,500 | $67,040 |
| 2014 | $5,680 | $77,540 | $10,500 | $67,040 |
| 2012 | -- | $78,330 | $13,300 | $65,030 |
Source: Public Records
Map
Nearby Homes
- 615 Burnside Dr
- 1786 Ashley Dr
- 766 Dunaway St
- 1808 Burnside Dr
- 902 Althea Dr
- 1907 Falling Leaf Ln Unit 35801TH
- 1902 Whispering Tree Dr Unit B
- 1901 Whispering Tree Dr Unit 34701
- 302 Trails Way Unit 27unb
- 1539 Commons Dr Unit 1539
- 1035 Woods View Ct
- 811 Moon Ct
- 1660 E Central Ave
- 233 Woodridge Dr
- 628 Jamestown Dr
- 727 Harnam Ct
- 1187 Mary Ln W
- 650 Decker Dr
- 2090 E Central Ave
- 712 Decker Dr