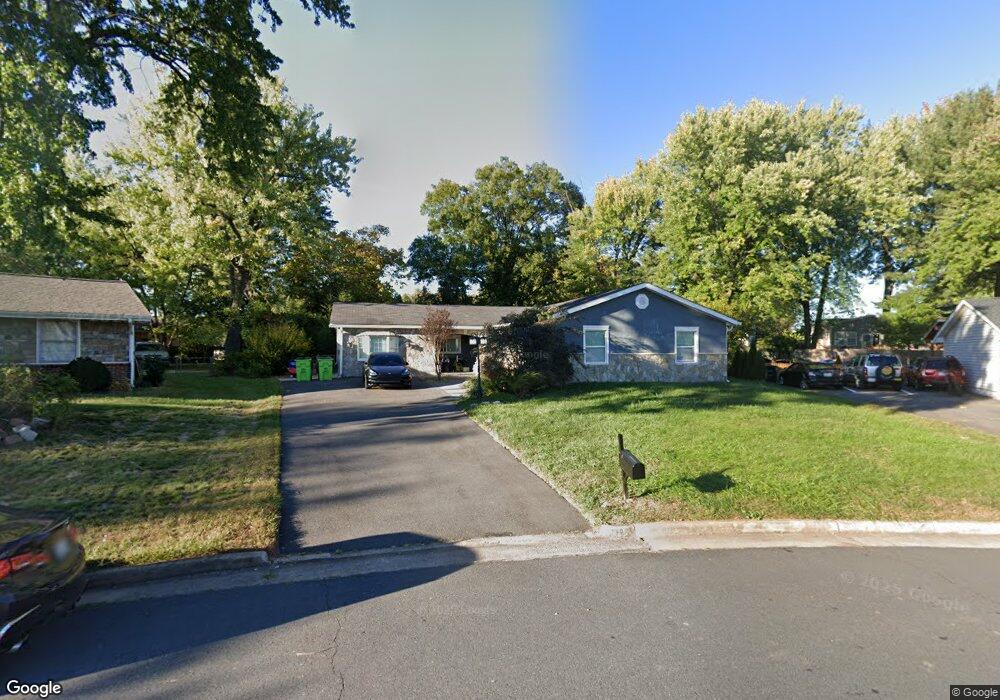
1811 N Brunswick St Sterling, VA 20164
Estimated Value: $646,000 - $696,459
4
Beds
2
Baths
2,436
Sq Ft
$279/Sq Ft
Est. Value
About This Home
This home is located at 1811 N Brunswick St, Sterling, VA 20164 and is currently estimated at $680,615, approximately $279 per square foot. 1811 N Brunswick St is a home located in Loudoun County with nearby schools including Rolling Ridge Elementary School, Sterling Middle School, and Park View High School.
Ownership History
Date
Name
Owned For
Owner Type
Purchase Details
Closed on
Oct 27, 2022
Sold by
Unknown
Bought by
Burks Joseph Robert
Current Estimated Value
Purchase Details
Closed on
Feb 27, 2014
Sold by
F And N Enterprises Llc
Bought by
Ghassemi Sharareh
Home Financials for this Owner
Home Financials are based on the most recent Mortgage that was taken out on this home.
Original Mortgage
$220,923
Interest Rate
5.37%
Mortgage Type
FHA
Purchase Details
Closed on
Apr 25, 2013
Sold by
Carmel Ventures Llc
Bought by
F And N Enterprises Llc
Purchase Details
Closed on
Apr 15, 2011
Sold by
Ghassemi Khosro
Bought by
Carmel Ventures Llc
Purchase Details
Closed on
Dec 1, 2006
Sold by
Messitt William E
Bought by
Ghassemi Khosro
Home Financials for this Owner
Home Financials are based on the most recent Mortgage that was taken out on this home.
Original Mortgage
$311,000
Interest Rate
6.36%
Mortgage Type
New Conventional
Create a Home Valuation Report for This Property
The Home Valuation Report is an in-depth analysis detailing your home's value as well as a comparison with similar homes in the area
Home Values in the Area
Average Home Value in this Area
Purchase History
| Date | Buyer | Sale Price | Title Company |
|---|---|---|---|
| Burks Joseph Robert | -- | Navy Federal Title Services, L | |
| Ghassemi Sharareh | $225,000 | -- | |
| F And N Enterprises Llc | $220,000 | -- | |
| Carmel Ventures Llc | $225,540 | -- | |
| Ghassemi Khosro | $388,800 | -- |
Source: Public Records
Mortgage History
| Date | Status | Borrower | Loan Amount |
|---|---|---|---|
| Previous Owner | Ghassemi Sharareh | $220,923 | |
| Previous Owner | Ghassemi Khosro | $311,000 |
Source: Public Records
Tax History
| Year | Tax Paid | Tax Assessment Tax Assessment Total Assessment is a certain percentage of the fair market value that is determined by local assessors to be the total taxable value of land and additions on the property. | Land | Improvement |
|---|---|---|---|---|
| 2025 | $5,163 | $641,320 | $239,500 | $401,820 |
| 2024 | $5,468 | $632,150 | $214,500 | $417,650 |
| 2023 | $4,873 | $556,930 | $214,500 | $342,430 |
| 2022 | $4,830 | $542,720 | $194,500 | $348,220 |
| 2021 | $4,750 | $484,710 | $184,500 | $300,210 |
| 2020 | $4,899 | $473,330 | $159,500 | $313,830 |
| 2019 | $4,650 | $444,950 | $159,500 | $285,450 |
| 2018 | $4,536 | $418,060 | $144,500 | $273,560 |
| 2017 | $4,518 | $401,610 | $144,500 | $257,110 |
| 2016 | $4,403 | $384,570 | $0 | $0 |
| 2015 | $4,093 | $234,640 | $0 | $234,640 |
| 2014 | $4,003 | $220,600 | $0 | $220,600 |
Source: Public Records
Map
Nearby Homes
- 104 W Amhurst Place
- 1607 N Brunswick St
- 111 Connemara Dr
- 46733 Hollow Mountain Place
- 21491 Rusty Blackhaw Square
- 1301 N Amelia St
- 46348 Mount Kellogg Terrace
- 206 Cardinal Glen Cir
- 21512 Tamarack Ridge Square
- 304 E Gordon St
- 46337 Reddish Knob Dr
- 46724 Fielding Terrace Unit 49
- 21113 Chandler Ct
- 214 Leslie Ct
- 21228 Mcfadden Square Unit 413
- 21216 Mcfadden Square Unit 108
- 46942 Colby Ct
- 46710 Flicker Terrace
- 46944 Trumpet Cir
- 21039 Barcroft Way
- 1809 N Brunswick St
- 1813 N Brunswick St
- 301 W Amhurst Place
- 303 W Amhurst Place
- 205 W Amhurst Place
- 1902 N Amelia St
- 1900 N Amelia St
- 1807 N Brunswick St
- 1815 N Brunswick St
- 1806 N Brunswick St
- 1806 N Amelia St
- 305 W Amhurst Place
- 203 W Amhurst Place
- 2000 N Amelia St
- 1805 N Brunswick St
- 1804 N Amelia St
- 1817 N Brunswick St
- 1804 N Brunswick St
- 1808 N Brunswick St
- 300 W Amhurst Place
Your Personal Tour Guide
Ask me questions while you tour the home.