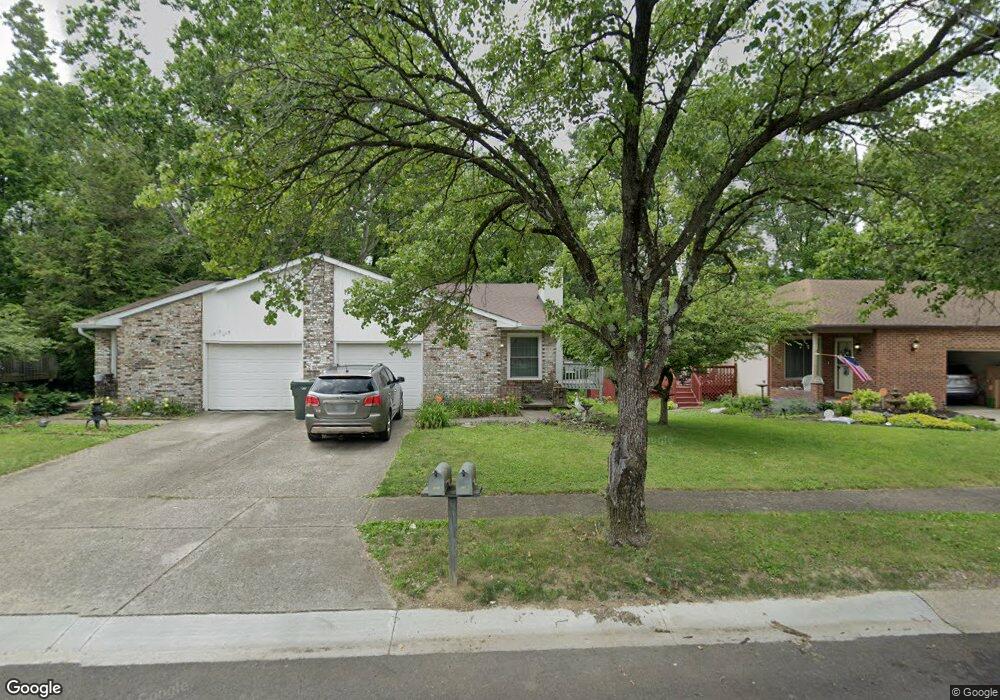
1811 Quarry Ridge Dr Unit 813 Columbus, OH 43232
Livingston-McNaughten NeighborhoodEstimated Value: $280,475 - $326,000
4
Beds
4
Baths
2,074
Sq Ft
$148/Sq Ft
Est. Value
About This Home
This home is located at 1811 Quarry Ridge Dr Unit 813, Columbus, OH 43232 and is currently estimated at $307,369, approximately $148 per square foot. 1811 Quarry Ridge Dr Unit 813 is a home located in Franklin County with nearby schools including Oakmont Elementary School, Yorktown Middle School, and Independence High School.
Ownership History
Date
Name
Owned For
Owner Type
Purchase Details
Closed on
Jul 27, 2016
Sold by
Mauger Shane M
Bought by
Elliott Robert B and Elliott Pamela M
Current Estimated Value
Home Financials for this Owner
Home Financials are based on the most recent Mortgage that was taken out on this home.
Original Mortgage
$134,518
Outstanding Balance
$107,330
Interest Rate
3.48%
Mortgage Type
FHA
Estimated Equity
$200,039
Purchase Details
Closed on
Jul 30, 2001
Sold by
Smith Margaret Ann
Bought by
Mauger Shane M
Home Financials for this Owner
Home Financials are based on the most recent Mortgage that was taken out on this home.
Original Mortgage
$175,595
Interest Rate
7.15%
Mortgage Type
FHA
Purchase Details
Closed on
Feb 27, 2001
Sold by
Estate Of Margaret Scott Mckay
Bought by
Smith Margaret Ann
Purchase Details
Closed on
Sep 28, 1990
Bought by
Smith Margaret A
Purchase Details
Closed on
Jul 1, 1985
Create a Home Valuation Report for This Property
The Home Valuation Report is an in-depth analysis detailing your home's value as well as a comparison with similar homes in the area
Home Values in the Area
Average Home Value in this Area
Purchase History
| Date | Buyer | Sale Price | Title Company |
|---|---|---|---|
| Elliott Robert B | $137,000 | None Available | |
| Mauger Shane M | $177,000 | Chicago Title | |
| Smith Margaret Ann | -- | -- | |
| Smith Margaret A | -- | -- | |
| -- | $25,000 | -- |
Source: Public Records
Mortgage History
| Date | Status | Borrower | Loan Amount |
|---|---|---|---|
| Open | Elliott Robert B | $134,518 | |
| Closed | Mauger Shane M | $175,595 |
Source: Public Records
Tax History Compared to Growth
Tax History
| Year | Tax Paid | Tax Assessment Tax Assessment Total Assessment is a certain percentage of the fair market value that is determined by local assessors to be the total taxable value of land and additions on the property. | Land | Improvement |
|---|---|---|---|---|
| 2024 | $3,529 | $77,000 | $21,070 | $55,930 |
| 2023 | $3,962 | $87,535 | $21,070 | $66,465 |
| 2022 | $3,123 | $58,770 | $30,280 | $28,490 |
| 2021 | $3,129 | $58,770 | $30,280 | $28,490 |
| 2020 | $3,133 | $58,770 | $30,280 | $28,490 |
| 2019 | $3,177 | $51,100 | $26,320 | $24,780 |
| 2018 | $3,216 | $51,100 | $26,320 | $24,780 |
| 2017 | $3,379 | $51,100 | $26,320 | $24,780 |
| 2016 | $3,582 | $52,720 | $11,590 | $41,130 |
| 2015 | $3,261 | $52,720 | $11,590 | $41,130 |
| 2014 | $3,269 | $52,720 | $11,590 | $41,130 |
| 2013 | $1,697 | $55,475 | $12,180 | $43,295 |
Source: Public Records
Map
Nearby Homes
- 1603 Hallworth Ct Unit 16038
- 5781 Hallridge Cir Unit B
- 5596 Autumn Chase Dr
- 1481 Riverton Ct E
- 5794 Hallridge Cir
- 1888 Birkdale Dr
- 1826-1828 Bairsford Dr
- 5750 Hallridge Cir
- 0 Radekin Rd Unit 225029852
- 1550 Idlewild Dr
- 1942 Bairsford Dr Unit 944
- 1859 Woodette Rd
- 1759 Lonsdale Rd
- 1334 Manor Dr
- 1328 Manor Dr
- 5366 Yorkshire Village Ln Unit B-22
- 0 Brice Rd
- 5337 Ivyhurst Dr
- 1624 Coppertree Ln
- 1616 Coppertree Rd Unit 1615
- 1797 Quarry Ridge Dr Unit A
- 1821 Quarry Ridge Dr Unit 823
- 1795 Quarry Ridge Dr Unit 1B
- 1835 Quarry Ridge Dr Unit 837
- 1800-1802 Quarry Ridge Dr
- 5946 Rock Glen Ct
- 1800 Quarry Ridge Dr Unit 802
- 1800 Quarry Ridge Dr
- 5933 Little Brook Way
- 1783 Quarry Ridge Dr
- 1788 Quarry Ridge Dr Unit 790
- 1782 Quarry Ridge Dr
- 5921 Little Brook Way Unit 923
- 0 Little Brook Way Unit 8 2210025
- 0 Little Brook Way Unit 6 2210022
- 0 Little Brook Way
- 5954 Rock Glen Ct Unit 956
- 5963 Little Brook Way Unit 965
- 5965 Little Brook Way
- 5953-55 Rock Glen Ct