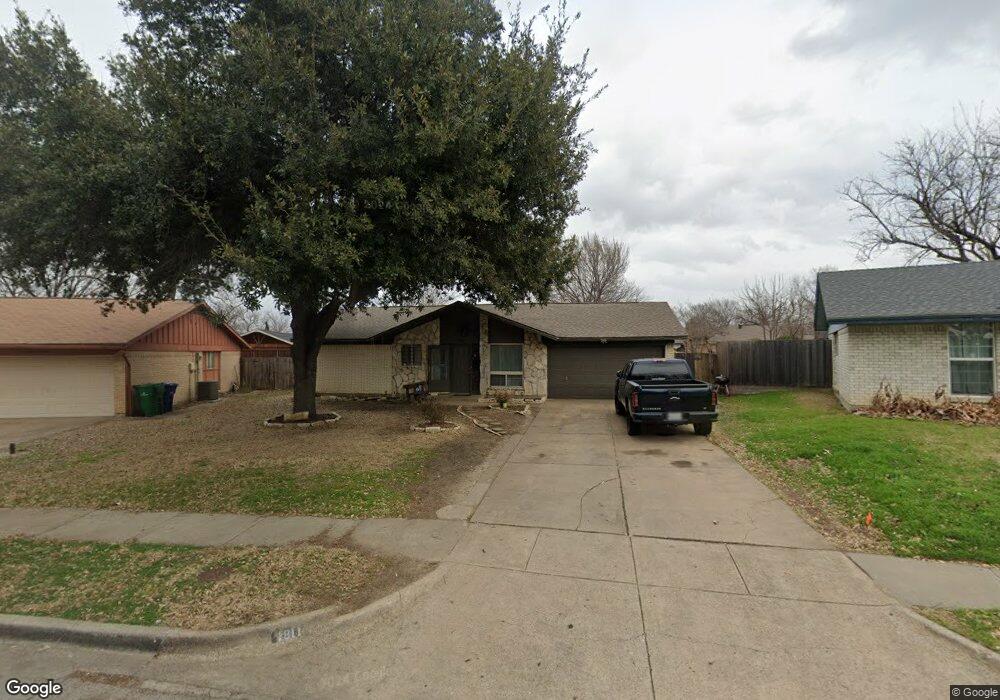
1811 Redbud Cir Carrollton, TX 75006
Original Town NeighborhoodEstimated Value: $321,000 - $369,000
3
Beds
2
Baths
1,603
Sq Ft
$213/Sq Ft
Est. Value
About This Home
This home is located at 1811 Redbud Cir, Carrollton, TX 75006 and is currently estimated at $341,293, approximately $212 per square foot. 1811 Redbud Cir is a home located in Dallas County with nearby schools including Mccoy Elementary School, Perry Middle School, and Smith High School.
Ownership History
Date
Name
Owned For
Owner Type
Purchase Details
Closed on
Feb 28, 2011
Sold by
Marchant S E
Bought by
Esparza Guadalupe G and Briones Hern Leonardo
Current Estimated Value
Home Financials for this Owner
Home Financials are based on the most recent Mortgage that was taken out on this home.
Original Mortgage
$109,160
Outstanding Balance
$76,608
Interest Rate
5.25%
Mortgage Type
FHA
Estimated Equity
$264,685
Purchase Details
Closed on
Oct 15, 2010
Sold by
Mora Julia M and Richerson Julia
Bought by
Marchant S E
Purchase Details
Closed on
Jan 18, 2010
Sold by
Richerson Timothy L
Bought by
Richerson Julia
Purchase Details
Closed on
Oct 23, 1998
Sold by
Va
Bought by
Richerson Timothy L and Mora Julia M
Home Financials for this Owner
Home Financials are based on the most recent Mortgage that was taken out on this home.
Original Mortgage
$96,950
Interest Rate
6.75%
Mortgage Type
Seller Take Back
Purchase Details
Closed on
Apr 7, 1998
Sold by
First Nationwide Mtg Corp
Bought by
Va
Create a Home Valuation Report for This Property
The Home Valuation Report is an in-depth analysis detailing your home's value as well as a comparison with similar homes in the area
Home Values in the Area
Average Home Value in this Area
Purchase History
| Date | Buyer | Sale Price | Title Company |
|---|---|---|---|
| Esparza Guadalupe G | -- | Reunion | |
| Marchant S E | -- | Rtt | |
| Richerson Julia | -- | Rtt | |
| Richerson Timothy L | -- | -- | |
| Va | -- | -- | |
| First Nationwide Mtg Corp | $65,710 | -- |
Source: Public Records
Mortgage History
| Date | Status | Borrower | Loan Amount |
|---|---|---|---|
| Open | Esparza Guadalupe G | $109,160 | |
| Previous Owner | Richerson Timothy L | $96,950 | |
| Closed | Richerson Julia | $0 |
Source: Public Records
Tax History Compared to Growth
Tax History
| Year | Tax Paid | Tax Assessment Tax Assessment Total Assessment is a certain percentage of the fair market value that is determined by local assessors to be the total taxable value of land and additions on the property. | Land | Improvement |
|---|---|---|---|---|
| 2025 | $6,252 | $304,160 | $70,000 | $234,160 |
| 2024 | $6,252 | $304,160 | $70,000 | $234,160 |
| 2023 | $6,252 | $304,160 | $70,000 | $234,160 |
| 2022 | $5,438 | $239,040 | $70,000 | $169,040 |
| 2021 | $5,164 | $215,140 | $45,000 | $170,140 |
| 2020 | $5,340 | $215,140 | $45,000 | $170,140 |
| 2019 | $4,067 | $155,140 | $35,000 | $120,140 |
| 2018 | $4,092 | $155,140 | $35,000 | $120,140 |
| 2017 | $3,793 | $143,140 | $23,000 | $120,140 |
| 2016 | $3,281 | $123,820 | $23,000 | $100,820 |
| 2015 | $2,870 | $111,140 | $23,000 | $88,140 |
| 2014 | $2,870 | $111,140 | $23,000 | $88,140 |
Source: Public Records
Map
Nearby Homes
- 1803 Sherwood Place
- 1614 Camero Dr
- 2000 San Michael Dr
- 1202 Ryan Ave
- 2100 Rheims Dr
- 1112 Terrace Trail
- 1206 Osceola Trail
- 2153 Parkview
- 1205 Osceola Trail
- 2125 Mcparland Ct
- 1805 English Ln
- 1501 Cecil Dr
- 1105 Ryan Ave
- 1514 Baxley St
- 1101 Noble Ave
- 1201 Brittainy Place
- 2111 Menton Place
- 1581 Jackson St
- 2211 Salem Dr
- 2004 Palo Alto Dr
- 1813 Redbud Cir
- 1800 Redbud Cir
- 1809 Redbud Cir
- 1814 Elmwood Ln
- 1812 Elmwood Ln
- 1810 Elmwood Ln
- 1816 Elmwood Ln
- 1815 Redbud Cir
- 1807 Redbud Cir
- 1808 Elmwood Ln
- 1810 Redbud Cir
- 1818 Elmwood Ln
- 1812 Redbud Cir
- 1806 Elmwood Ln
- 1806 Redbud Cir
- 1805 Redbud Cir
- 1814 Redbud Cir
- 1819 Elmwood Ln
- 1833 Elmwood Ln
- 1813 Elmwood Ln