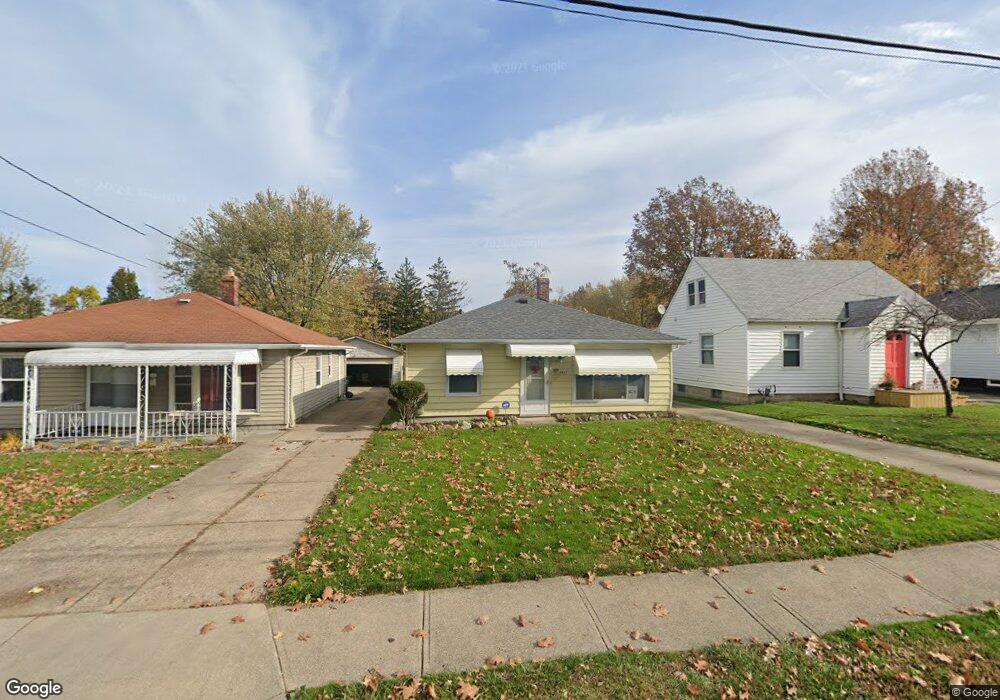
1811 Robindale St Wickliffe, OH 44092
Estimated Value: $156,403 - $187,000
2
Beds
1
Bath
1,008
Sq Ft
$167/Sq Ft
Est. Value
About This Home
This home is located at 1811 Robindale St, Wickliffe, OH 44092 and is currently estimated at $168,351, approximately $167 per square foot. 1811 Robindale St is a home located in Lake County with nearby schools including Wickliffe Elementary School, Wickliffe Middle School, and Wickliffe High School.
Ownership History
Date
Name
Owned For
Owner Type
Purchase Details
Closed on
Jan 11, 2018
Sold by
Mcchesney Jennifer L
Bought by
Mcchesney Rhianna and Mcchesney Andrew J
Current Estimated Value
Purchase Details
Closed on
Mar 17, 2000
Sold by
Andrew Mcchesney
Bought by
Mcchesney Jennifer L
Purchase Details
Closed on
Mar 27, 1996
Sold by
Zampini Paul W
Bought by
Mcchesney Andrew and Mcchesney Jennifer
Home Financials for this Owner
Home Financials are based on the most recent Mortgage that was taken out on this home.
Original Mortgage
$64,600
Outstanding Balance
$1,272
Interest Rate
6.98%
Mortgage Type
New Conventional
Estimated Equity
$167,079
Purchase Details
Closed on
Sep 22, 1995
Sold by
Est Jonathan N Brooks
Bought by
Zampini Paul
Home Financials for this Owner
Home Financials are based on the most recent Mortgage that was taken out on this home.
Original Mortgage
$22,000
Interest Rate
7.78%
Mortgage Type
New Conventional
Create a Home Valuation Report for This Property
The Home Valuation Report is an in-depth analysis detailing your home's value as well as a comparison with similar homes in the area
Home Values in the Area
Average Home Value in this Area
Purchase History
| Date | Buyer | Sale Price | Title Company |
|---|---|---|---|
| Mcchesney Rhianna | -- | None Available | |
| Mcchesney Jennifer L | -- | -- | |
| Mcchesney Andrew | $68,000 | -- | |
| Zampini Paul | $44,000 | -- |
Source: Public Records
Mortgage History
| Date | Status | Borrower | Loan Amount |
|---|---|---|---|
| Open | Mcchesney Andrew | $64,600 | |
| Previous Owner | Zampini Paul | $22,000 |
Source: Public Records
Tax History
| Year | Tax Paid | Tax Assessment Tax Assessment Total Assessment is a certain percentage of the fair market value that is determined by local assessors to be the total taxable value of land and additions on the property. | Land | Improvement |
|---|---|---|---|---|
| 2025 | -- | $53,930 | $15,620 | $38,310 |
| 2024 | -- | $53,930 | $15,620 | $38,310 |
| 2023 | $3,991 | $32,450 | $13,200 | $19,250 |
| 2022 | $2,328 | $32,450 | $13,200 | $19,250 |
| 2021 | $2,334 | $32,450 | $13,200 | $19,250 |
| 2020 | $2,018 | $23,800 | $10,580 | $13,220 |
| 2019 | $554 | $23,800 | $10,580 | $13,220 |
| 2018 | $1,038 | $23,800 | $10,580 | $13,220 |
| 2017 | $1,675 | $23,800 | $10,580 | $13,220 |
| 2016 | $1,807 | $25,810 | $10,580 | $15,230 |
| 2015 | $1,776 | $25,810 | $10,580 | $15,230 |
| 2014 | $1,564 | $25,810 | $10,580 | $15,230 |
| 2013 | $1,563 | $25,810 | $10,580 | $15,230 |
Source: Public Records
Map
Nearby Homes
- 1540 E 298th St
- 1526 E 298th St
- 1807 E 294th St
- 1719 E 300th St
- 1597 Lee Terrace Dr Unit F11
- 1842 Eldon Dr
- 30302 Overlook Dr
- 30350 Twin Lakes Dr
- 0 Green Ridge Dr
- 29315 Nehls Park Dr
- 30530 Grant St
- 2265 Country Club Dr
- 30529 Ridge Rd
- 2250 Pine Ridge Dr
- 29800 Robert St
- 28900 Euclid Ave
- 30335 Euclid Ave Unit 40 and 20
- 29566 Shaker Dr
- 1677 Mapledale Rd
- 28756 Hazel Ave
- 1807 Robindale St
- 1815 Robindale St
- 1803 Robindale St
- 1819 Robindale St
- 1753 Robindale St
- 1823 Robindale St
- 1720 Robindale St
- 1733 Robindale St Unit UP
- 1733 Robindale St Unit DN
- 1733 Robindale St
- 1733 Robindale St Unit Down
- 1827 Robindale St
- 1810 Robindale St
- 1812 Robindale St
- 1802 Robindale St
- 1808 E 298th St
- 1727 Robindale St
- 1831 Robindale St
- 1812 E 298th St
- 1816 Robindale St
Your Personal Tour Guide
Ask me questions while you tour the home.